Exploring the basics of Tensorflow and its API usage in python
api.py
- teaching a computer using examples.
- a computer is shown many labeled examples, and it learns to make predictions or decisions based on that data.
Types
1. Linear Regression
2. Logistic Regression
3. Decision Trees
4. Random Forests
5. Support Vector Machines(SVM's)
- Linear Regression
- (algorithm used to model the relationship between dependent variable and one or more independent variable. )
- (goal is to find thye best fit line that describes the relationship between variables.) ()
linearRegression.ipynb
car_purchasing_data.csv (dataset)
- Logistic Regression
-
(used to analyse the datasets with one or more independent variables)
-
(useful to predict the probability of an event occuring)
-
(in logistic Reg. dependent variable is binary that menas it has only two outcomes i.e., 1 or 0, Yes or No , true or False)
logisticRegression.ipynb
heartdiseases.csv (dataset)
- Decision Tree
-
(used for both classification and regression tasks)
-
(it creates tree like structure which helps us to find out the insights)
-
(it generally uses divide_and_conquer strategy.)
- Random Forest
-
(This is also used for both classification and regression tasks.)
-
(it is known for their ability to handle large datasets while providing accurate predictions.)
-
(it is a method which combines multiple decision tree to make prediction.)
-
(each single decision tree is built using random subset of trainig data.)
- Support Vector Machine (SVM)
-
(it classifies the data by finding slickest decision boundry betw different classes.)
-
(Finding the hyperplane which seperates the classes within data sets with max. margin .)
-
(hyperplane is determined by the SVM , which are the data points closest to the decision boundry. )
-
(SVM's are generally adaptible coz they can handle both binary classification(yes/no) and regression(numerical values).)
- letting a computer figure things out on its own without any labeled examples.
- the computer looks at data and tries to find patterns or groupings on its own.
Types
1. K- means clustering
2.  hierarchical clusturing
3. Principal component Analysis
- K-means clustering
- (It is a way to group a bunch of data points into clusters based on their features.)
- (The idea behind K-means is to split these dots into "K" number of groups.)
STEPS :-
-
Choose K: Decide how many clusters (K) you want. -
Place K centroids: These are initial points (think of them as centers) placed randomly on the scatter plot. -
Assign points to clusters: Each dot (data point) is assigned to the nearest centroid. -
Recalculate centroids: For each cluster, calculate the new centroid by finding the average of all the data points in the cluster. -
Repeat: Reassign data points to the nearest centroid and recalculate the centroids.
- Hierarchical Clustering
- (It is a method that groups similar data points together based on their similarity or dissimilarity.)
- (It results in hierarchical structure.)
- (Can be visualized as a dendrogram(shows order in which cluster were merged).)
Advantages
- it doesn't require specifying the number of clusters in advance, allowing for an automatic determination based on the data.
- it provides an intuitive visualization through dendrograms, enabling us to explore different clustering possibilities.
- it captures hierarchical relationships which can reveal nested structures within the data.
Limitations
- expensive, particularly for large datasets due to the need to compute pairwise distances.
- It can also be sensitive to noise and outliers affecting the clustering results.
- dealing with categorical or mixed data types can be challenging in hierarchical clustering.
- PCA (Principal Component Analysis)
- ( technique used to reduce the dimensionality of a dataset whilst retaining as much of the original information as possible.)
- (This method is excellent for simplifying data while keeping its essential patterns, making it easier to analyze and visualize.)
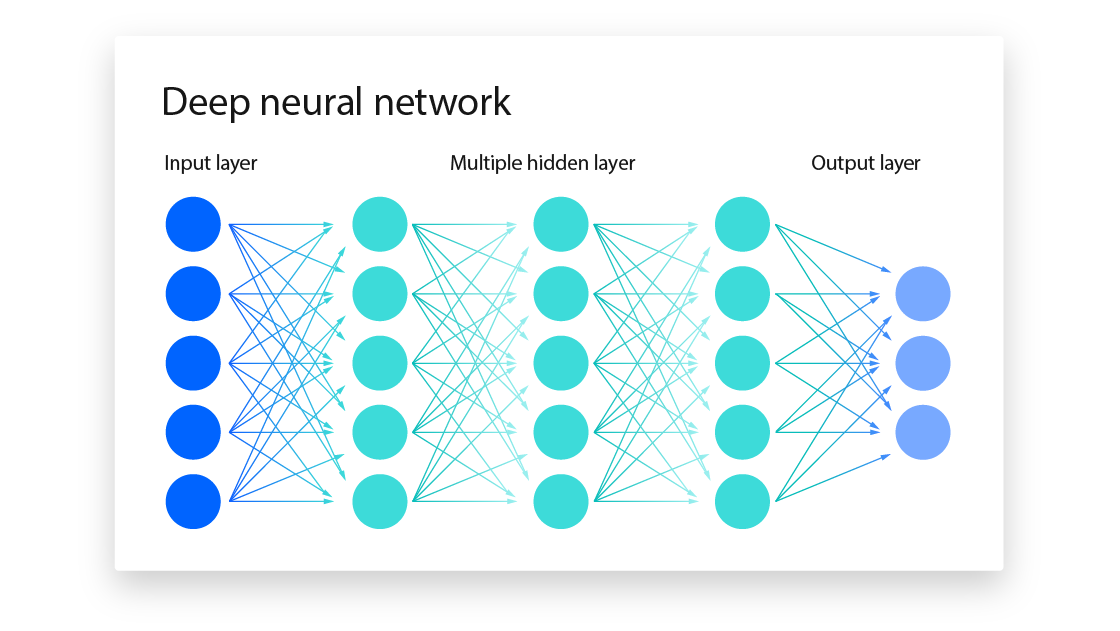
- Neural networks are inspired by the structure and function of the human brain, which consists of billions of neurons that communicate with each other through electrical signals.
- designed to mimic this brain-like behavior to solve complex problems.
- composed of layers of artificial neurons (units or nodes).
- first layer is called theinput layer, which receives the data that we want to analyze or manipulate.
- The last layer is called theoutput layer, which produces the result or prediction that we are interested in.
- In between the input and output layers, there can be one or morehidden layerswhich perform intermediate computations and transformations on the data.
Types
1. Feedforward Neural Networks (FNN)
2. Convolutional Neural Networks (CNN)
3. Recurrent Neural Networks (RNN)
1. FNN
-
processes data in
one direction—from input to output—without looping back. -
connections between the nodes do not form cycles.
-
The network consists of an input layer, one or more hidden layers, and an output layer.

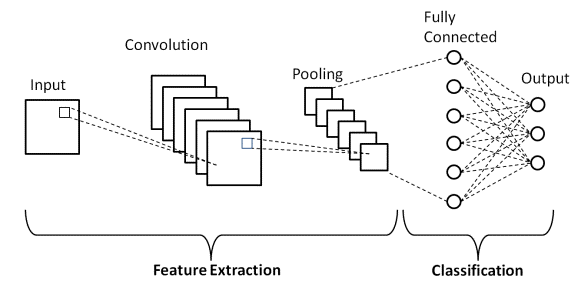
2. CNN
-
designed to effectively process grid-like data, such as images.
-
specifically designed to handle image data.
-
<Convolutional Layer>- this layer scans the image with small filters, these filters detect features such as edges, textures, or colors by looking at small sections of the image at a time.<Pooling Layer>- responsible for the reduction of the size(downsamples).It is responsible for the reduction of the size.<Fully Connected Layer>- This is where the network makes sense of all the extracted features and makes a prediction.<Output Layer>- Finally, the output layer provides the final result.