Magnitude
Magnitudes are central to Phosphorpy because magnitudes are needed for colors and fluxes.
The magnitude module is initialized after the first data are downloaded from Vizier. A default cross-match radius is set to 1 arcsec, which typically is suitable for surveys of comparable depths. In the case of multiple observations by one survey the mean value out of the values is computed. NaN values are ignored in this. Hereafter, the magnitudes are available and can be used for further steps.
Currently, GALEX, SDSS, KiDS, Pan-STARRS, Gaia, UKIDSS, VIKING, 2MASS and WISE are implemented.
One option of the magnitudes module is masking data. The masking system provides multi-masking, which means that multiple masks can be created. These masks can build on each other or can be independent of each other.
For example a magnitude limit can be applied to one magnitude column and a color limit (e.g. over a specific range of valid colors) can be applied as well.
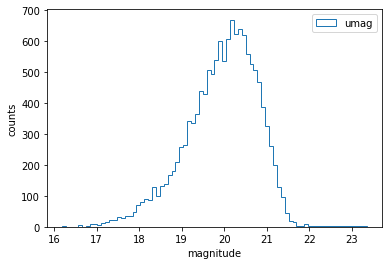
At the moment the magnitudes module has only one plotting option. This is a simple histogram of the magnitude distribution. It is possible to plot one or multiple magnitudes in one graph.
To plot a histogram of a DataSet ds, which contains SDSS data, use:
# plot the u magnitude distribution
ds.magnitudes.plot.hist('u')
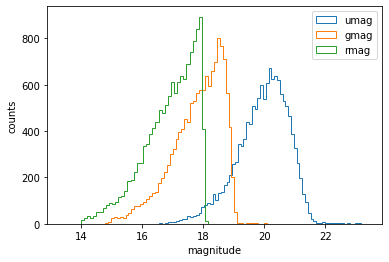
# plot the u, g and r magnitude distribution at once
ds.magnitudes.plot.hist(['u', 'g', 'r'])