Transforming 18 years of educational data into actionable insights for 120,000+ students

➡️ Explore the Interactive Map
📰 Read the Featured LinkedIn Article
"A comprehensive data pipeline and visualization system that processes 1M+ records to help families make informed decisions about high school education in Massachusetts."
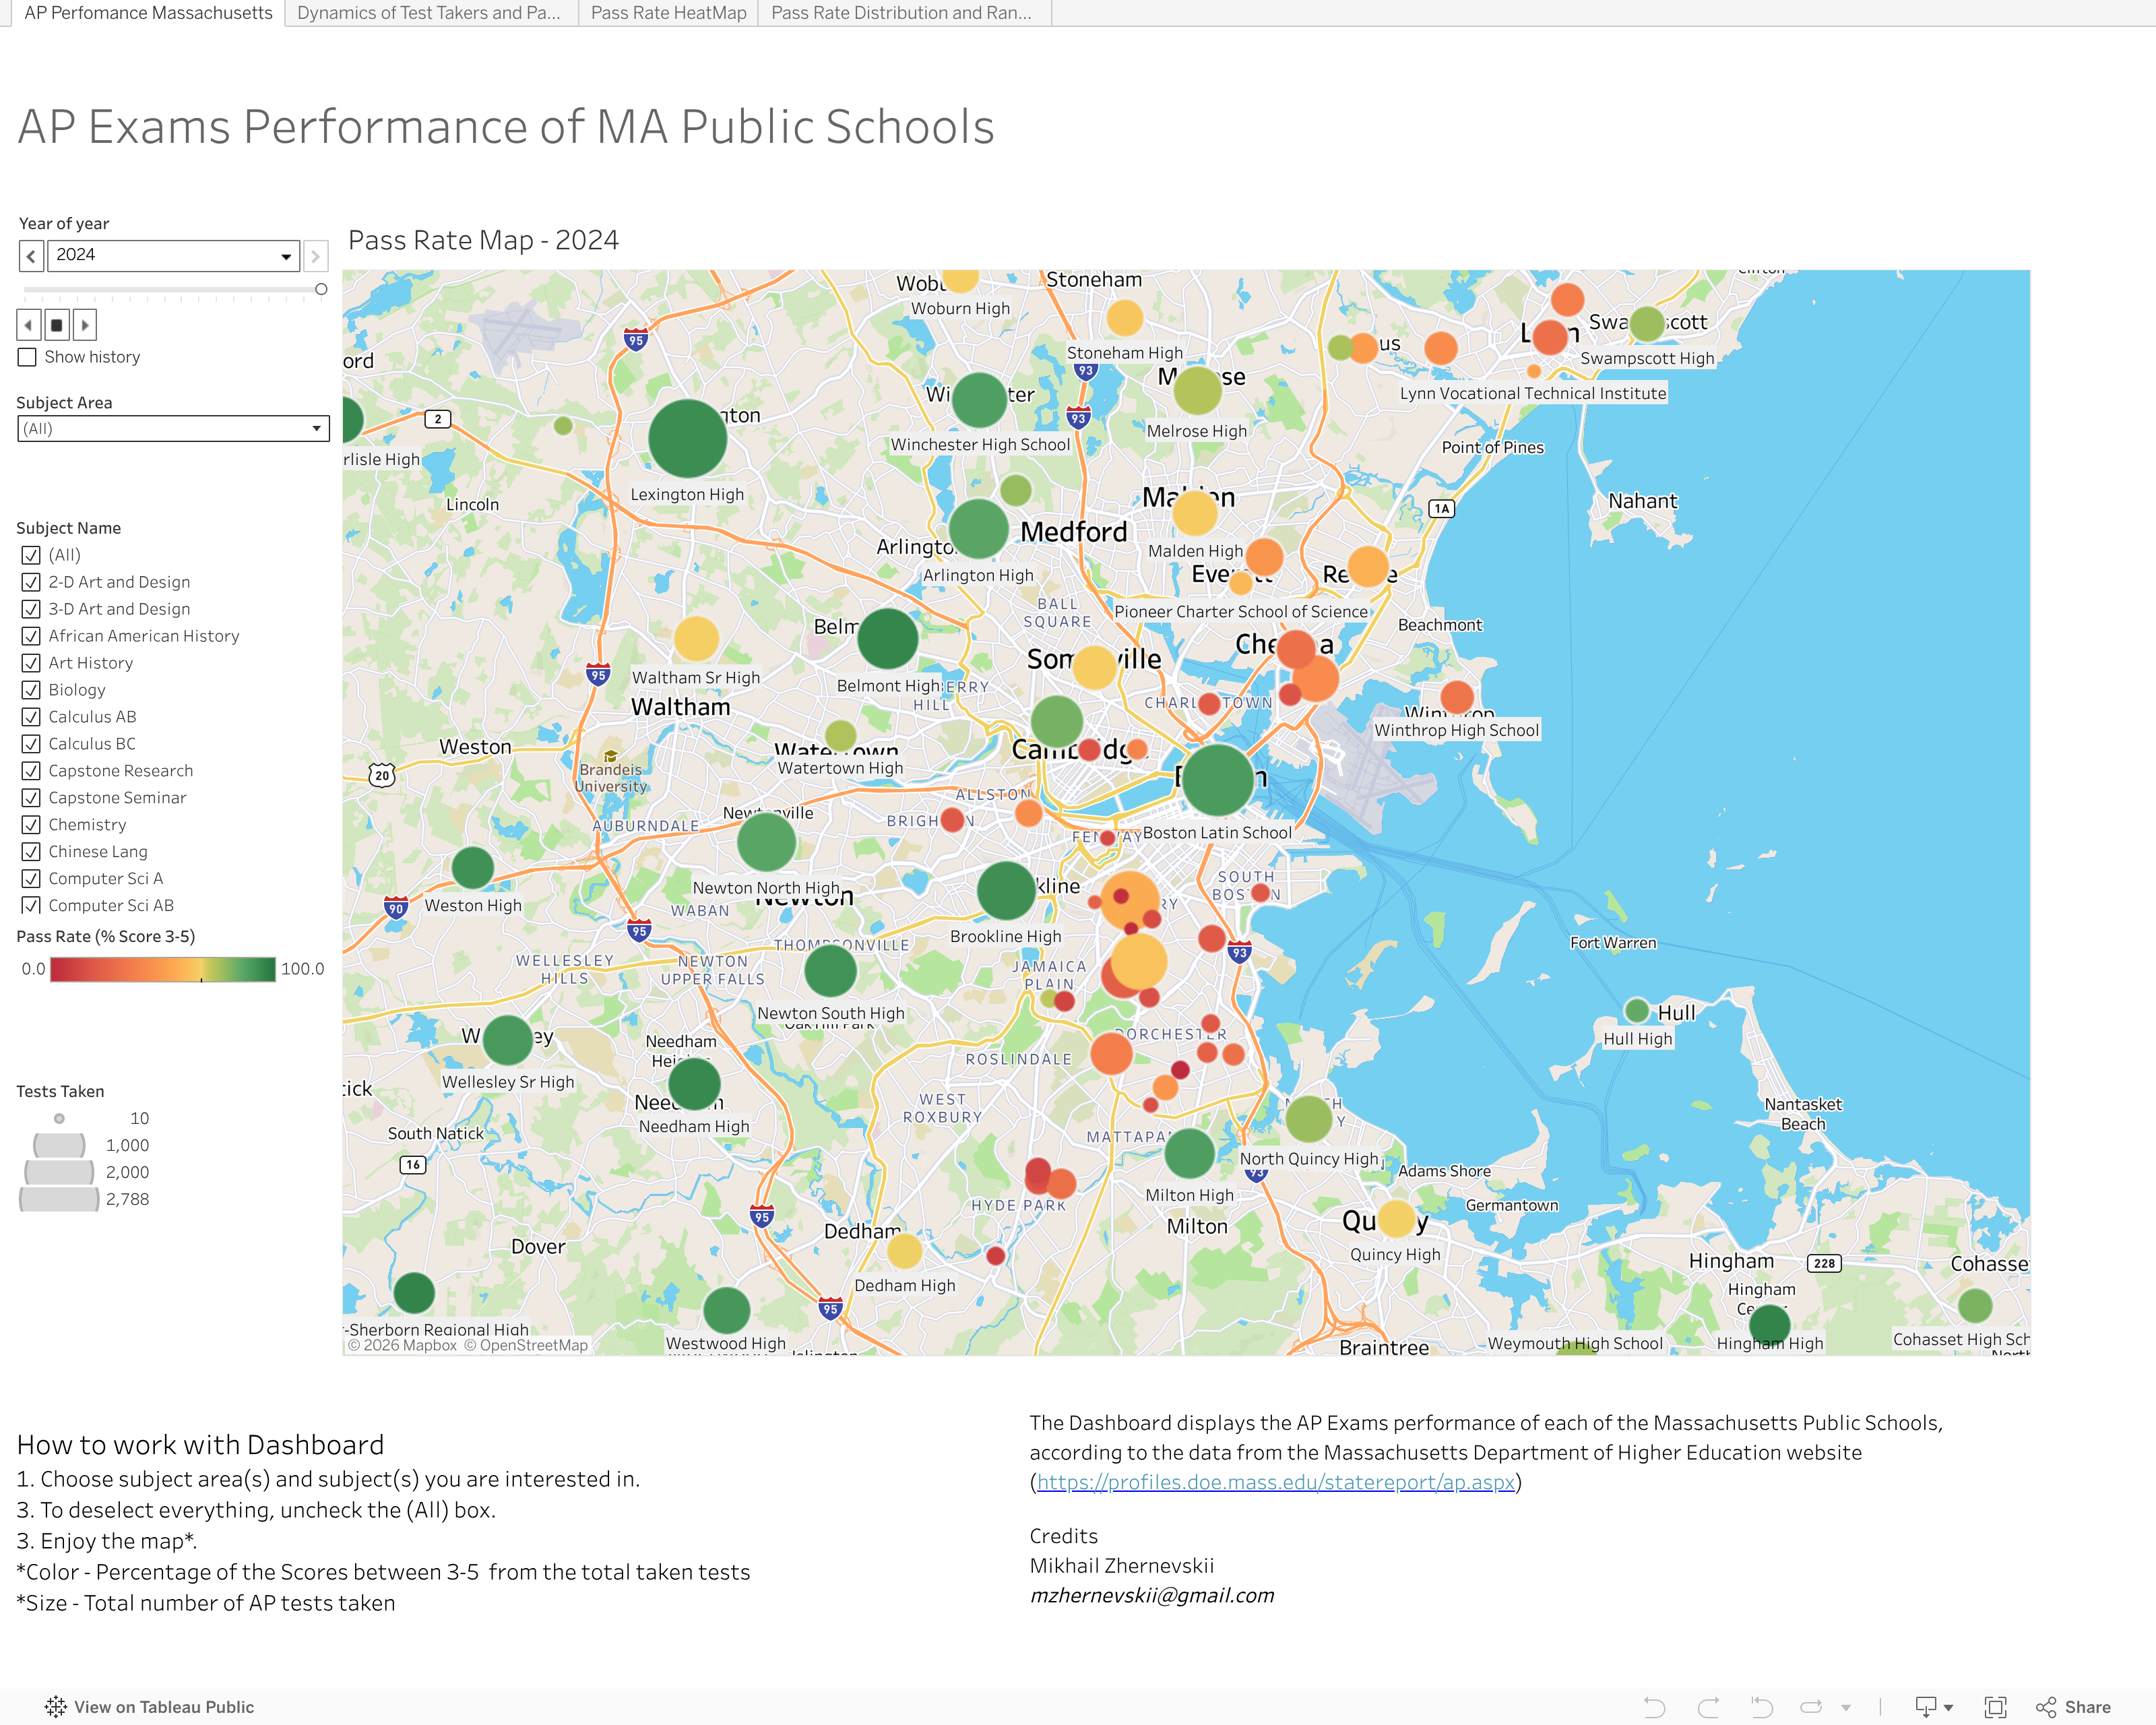
This project transforms raw Massachusetts Department of Education AP exam data spanning 18 years (2006-2024) into an interactive, geographical visualization that empowers students, parents, and educators to make data-driven educational decisions.
Key Impact:
- 120,000+ student records analyzed across Massachusetts
- 1M+ data points processed and enriched
- 1,500+ missing data points recovered using advanced algorithms
- 2,200+ LinkedIn article views helping families choose schools
- 40+ AP subject areas mapped across all MA public schools
- Geographic Mapping: Each school represented by color-coded dots indicating pass rates (3-5 scores)
- Size-Based Scaling: Circle size represents number of test takers
- Subject Filtering: Dynamic filtering across 40+ AP subjects
- Multi-Layer Analysis: Compare overall performance vs. subject-specific results
- PostgreSQL Database: Optimized schema for 1M+ educational records
- Python ETL Scripts: Automated data processing and cleaning
- C++ Recovery Algorithms: Advanced tree structures and set theory for missing data
- Google Maps API Integration: Geocoding for precise school locations
- Hierarchical Data Processing: Subject categorization with tree traversal algorithms
- Statistical Modeling: Performance metrics calculation and normalization
- Data Enrichment: Coordinate assignment and missing value interpolation
Raw CSV Data (MA Dept. of Education)
           ↓
Python Parser & Validator
           ↓
PostgreSQL Database (Normalized Schema)
           ↓
C++ Missing Data Recovery Engine
           ↓
Google Maps API Geocoding
           ↓
Tableau BI Visualization Layer
| Component | Technology | Purpose |
|---|---|---|
| Database | PostgreSQL 13+ | Primary data storage and querying |
| ETL Pipeline | Python 3.8+ | Data parsing, cleaning, and transformation |
| Data Recovery | C++ | Advanced algorithms for missing data points |
| Geocoding | Google Maps API | School coordinate assignment |
| Visualization | Tableau BI | Interactive dashboard and mapping |
| Web Layer | HTML5/CSS3 | Embedded dashboard presentation |
📦 AP-Exams-Interactive-Map/
├── 🐍 Data Processing Scripts
│   ├── parse_csv_into_facts.py      # Raw data parser
│   ├── clean_and_enrich_db_facts.py # Data cleaning & recovery
│   ├── upload_school_dim.py         # School dimension loader
│   └── convert_csv_to_xlsx.py       # Format converter
├── 📊 Data Files
│   ├── Facts/                       # Raw AP performance data
│   ├── FactsArchive/               # Historical data backups
│   ├── FactsUpd/                   # Processed data files
│   └── dimensions/                 # Lookup tables & metadata
├── 🗺️ Visualization Assets
│   └── mainpage.html               # Embedded Tableau dashboard
├── 🔧 Configuration & Utilities
│   ├── assistance_files/           # Helper scripts
│   ├── subjects.txt               # AP subject hierarchy
│   └── .gitignore                 # Git exclusions
└── 📋 Documentation
    ├── README.md                   # This file
    └── LICENSE                     # MIT License
- Python 3.8+ with required libraries
- PostgreSQL 13+ database server
- Google Maps API key (for geocoding)
- Tableau Desktop/Server (for visualization)
- Clone the repository
git clone https://github.com/mishajirx/AP-Exams-Interactive-Map.git
cd AP-Exams-Interactive-Map- Set up the database
# Create PostgreSQL database
createdb ap_performance_db

# Configure connection in config.py (not included for security)- Process the data
# Parse raw CSV data
python parse_csv_into_facts.py

# Upload school dimensions
python upload_school_dim.py

# Clean and enrich data (runs C++ recovery algorithms)
python clean_and_enrich_db_facts.py- View the visualization
Open
mainpage.htmlin your browser to see the embedded Tableau dashboard.
The project implements sophisticated C++ algorithms to recover missing data points:
- Tree-Based Processing: Uses hierarchical subject categorization
- Set Theory Operations: Applies intersection and union operations on subject sets
- Proportional Distribution: Distributes missing grades based on test volume ratios
- Breadth-First Traversal: Processes subject hierarchy using queue-based algorithm
- Identify Missing Data: Detect records with zero grade distributions
- Build Subject Hierarchy: Create tree structure of AP subjects
- Calculate Known Totals: Sum grades for available subjects in each branch
- Proportional Assignment: Distribute remaining grades based on test volumes
- Validate Results: Ensure statistical consistency across all levels
- ap_performance_facts: Main fact table with test scores and metrics
- school_dim: School master data with coordinates and metadata
- subject_dim: AP subject hierarchy and categorization
- Test Volume: Total number of exams taken per school/subject
- Pass Rate: Percentage of students scoring 3-5 (passing threshold)
- Score Distribution: Breakdown across all five AP score levels (1-5)
- Geographic Data: Latitude/longitude coordinates for mapping
- School Selection: Identify top-performing schools by subject area
- Program Evaluation: Compare AP offerings across districts
- Geographic Analysis: Find high-quality schools within desired areas
- Performance Benchmarking: Compare school performance against state averages
- Resource Allocation: Identify programs needing additional support
- Trend Analysis: Track performance changes over 18-year period
- Educational Equity: Visualize performance disparities across regions
- Data-Driven Decisions: Access comprehensive historical performance data
- Geographic Correlation: Analyze relationships between location and achievement
- 1,000,000+ individual student test records
- 120,000+ students tracked across 18 years
- 1,500+ missing data points successfully recovered
- 300+ Massachusetts public schools geocoded and mapped
- Sub-second query response times for interactive filtering
- 99.9% data accuracy after validation and cleanup
- Scalable architecture supporting additional years of data
- Responsive visualization supporting multiple device formats
We welcome contributions to improve the project! Here's how you can help:
- Fork the repository
- Create a feature branch (
git checkout -b feature/improvement) - Commit your changes (
git commit -m 'Add new feature') - Push to branch (
git push origin feature/improvement) - Open a Pull Request
- 🔧 Data pipeline optimizations
- 📊 Additional visualization features
- 🧮 Algorithm improvements
- 📚 Documentation enhancements
- 🧪 Test coverage expansion
This project is licensed under the MIT License - see the LICENSE file for details.
- Massachusetts Department of Elementary and Secondary Education for providing comprehensive AP performance data
- College Board for establishing the AP program and assessment standards
- Google Maps Platform for geocoding services enabling precise school mapping
- Tableau Community for visualization best practices and inspiration
Author: Mikhail (Misha) Zhernevskii
Institution: Johns Hopkins University - Computer Science
Achievement: USACO Platinum Competitor
- 💼 LinkedIn Profile
- 📧 Email: [Contact via LinkedIn]
- 🐙 GitHub Profile
- 🗺️ Interactive Map
- 📰 Featured Article (2,200+ views)
- 🏫 MA Education Data Portal
⭐ If this project helped you make educational decisions, please give it a star! ⭐
Empowering data-driven educational choices across Massachusetts