In early 2020, markets took a huge dive as the COVID-19 pandemic worsened. Uncertainty has led to lots of cost cutting, and some companies could still be scrambling for cash. Might this inhibit corporations' abilities to pay off their debt? On the other hand, low interest rates might lead companies to try to acquire more debt for cheap. What is the net effect these two conflicting trends might have on corporate structure and debt levels, and how does this vary by industry? And with the lower cost of borrowing, will firms overwhelmingly prefer to borrow to raise capital, rather than issue shares? An analysis will help understand a lot about how each industry is affected by things like consumer trends and the Fed’s policies, and may provide some future insight about what industries may be exposed to higher leverage risk going forward. It may also give an insight into how much financial strain companies are feeling as a result of the pandemic.
The data set comprises of S&P 1500 companies’ balance sheets and debt schedules pre-COVID-19 and currently. The S&P 1500 was chosen because it covers approximately 90% of the total market capitalization of US stocks,1 and is therefore representative of the US market as a whole. Data was retrieved from FactSet. The firm-by-firm data include:
- Debt during each of the past five quarters and EBITDA on an historical, annual basis over a few years ending December 2019 for all available firms
- Quarterly dividends per share from Q4 2019 to Q3 2020 for all available firms
- Share price every day from October 1, 2019 to September 30, 2020 for all available firms
- Quarterly shares outstanding from Q4 2019 to Q3 2020 for all available firms
- GICS classification meta-data for all S&P 1500 companies
Because only data where all this information were available for a given firm was usable, the final data set included only 1322 firms, as opposed to the 1500 in the S&P 1500. The majority of this discrepancy is attributable to firms where none of the past five years' EBITDA information was available on FactSet, so those firms were excluded from the sample.
I computed a normalized EBITDA using 2015-2019 annual EBITDA for each company. I then computed change in total debt each quarter. Next, to represent change in equity value, I calculated an average share price for each company for each quarter in study, and determined the total equity value raised or returned to shareholders as a result of:
- Share issuance or buybacks (assuming these all occurred at the average share price that quarter)
- Dividend payment
Equity value from share issuance or buybacks was calculated as:
I then computed the following ratios for each company on December 31, 2019, March 31, 2020, June 30, 2020 and September 30, 2020:
- Change in Total Debt/normalized EBITDA
- Change in Equity Value/normalized EBITDA
- Change in Equity Value attributable to dividend payments/normalized EBITDA
- Change in Equity Value attributable to share issuance or repurchase/normalized EBITDA
An extension to this analysis would be to determine whether there is a relationship between corporate bond yields and leverage changes (for example, does the data show reductions in leverage during quarters when corporate bond yields increased, and increases in leverage during quarters when corporate bond yields decreased; and if industry corporate bond yields are available, are changes in corporate bond yields by industry associated with changes in leverage by industry). This analysis was not performed during the course of this project.
Python was used to handle all data management and graph generation. The relational database management system used was SQLite, as it is included in the Python Standard Library. For graph generation, Matplotlib and NumPy were used. Github user cphyc's project matplotlib-label-lines was also used to make some of the graphs more readable.
Sample SQL and Python code can be found in Appendix A.
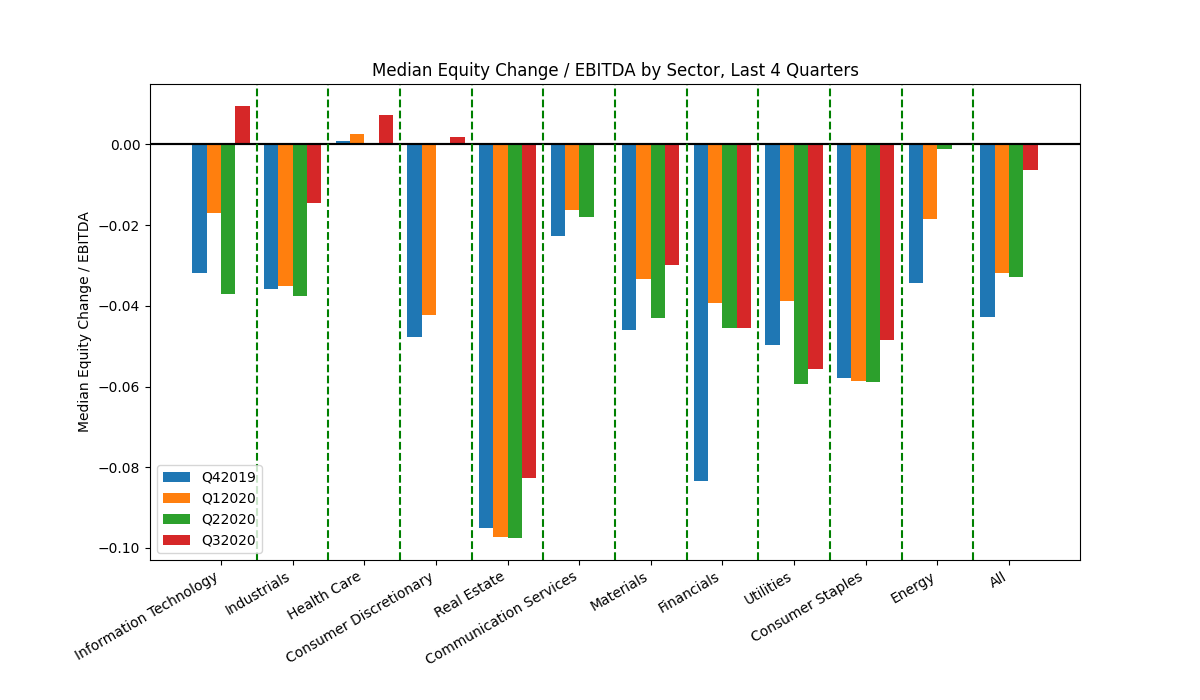
After calculating the above four ratios for all 1322 companies with complete data, I calculated medians for each of the 11 GICS Sectors for each of the past four quarters. These medians are graphed below:
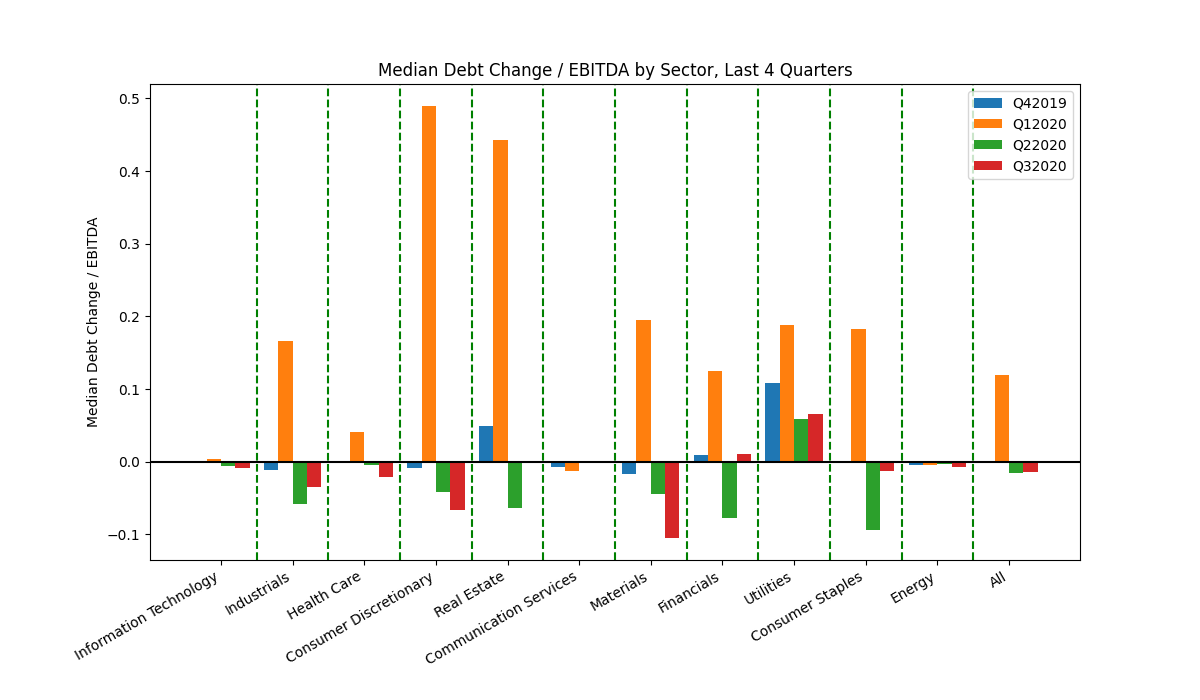
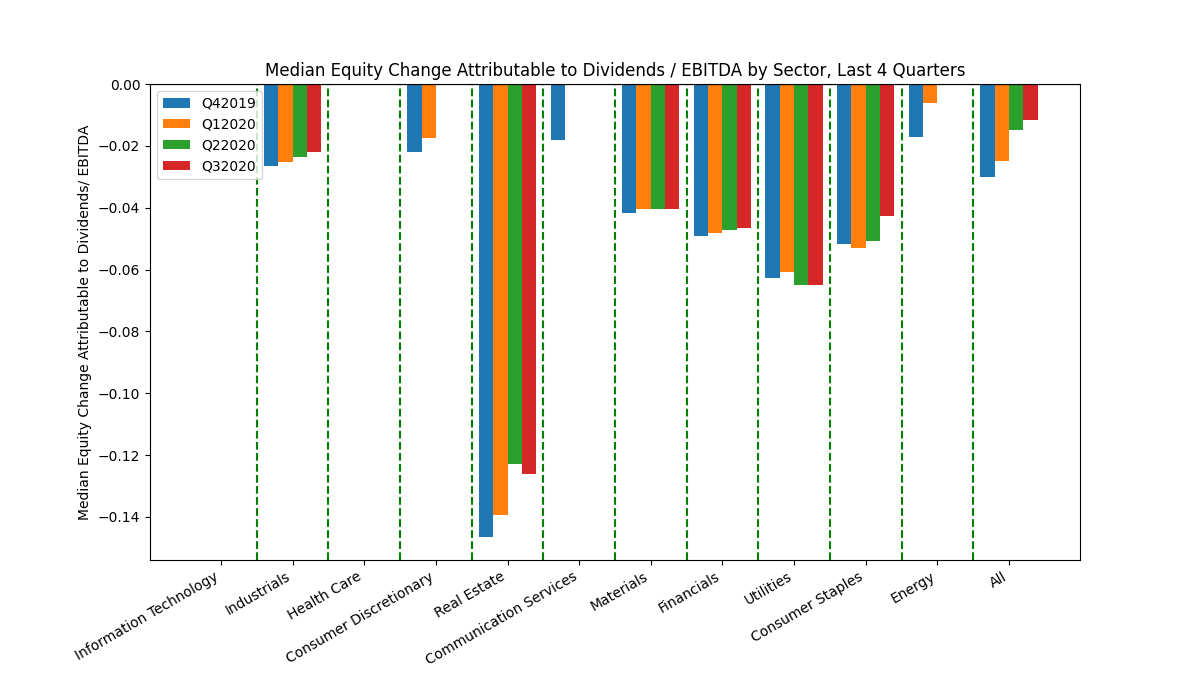
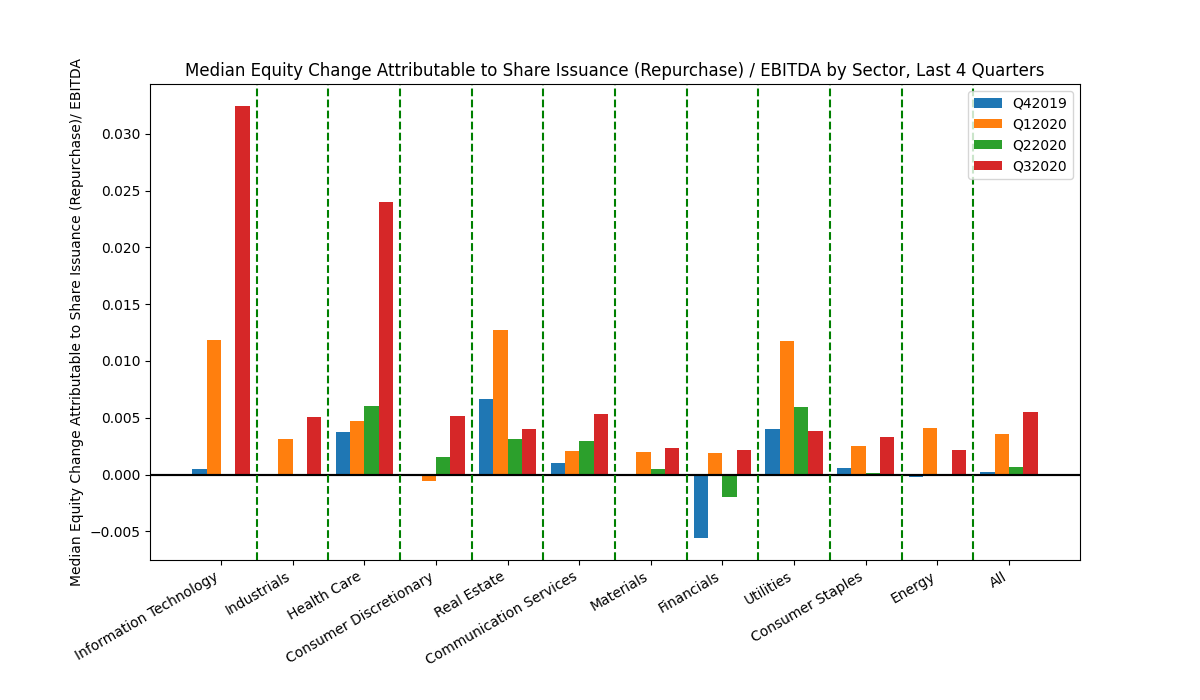
Some notable conclusions can be drawn from the above graphs. First, a lot of firms continued to pay dividends despite the financial strain on the economy as a whole. The median real estate firm paid out approximately 0.13x its annual EBITDA as a dividend at the end of each of the studied quarters. Part of this could be attributable to SEC requirements that real estate investment trusts (REITs) must pay out 90% of their taxable income annually in the form of dividends.2 The amount of equity raised from share issuance trended upwards over the past four quarters. Sectors like information technology and health care both saw sharp increases equity raised by share issuance in Q3 2020. Perhaps the most important takeaway from the above graphs is that the magnitude of capital raised by issuing debt, on average, far exceeded that of capital raised by issuing equity. The median consumer discretionary and real estate firm both issued debt on the order of 0.4-0.5x their annual EBITDA during just Q1 2020. While this could be a sign of financial distress due to COVID, it could also be a result of the incredibly low cost of borrowing.
Next, I graphed the running sum of each of the four ratios to quantify cumulative effect of changes in debt and equity across the past four quarters, holding levels at the end of Q3 2019 as the "0." The graphs are below:
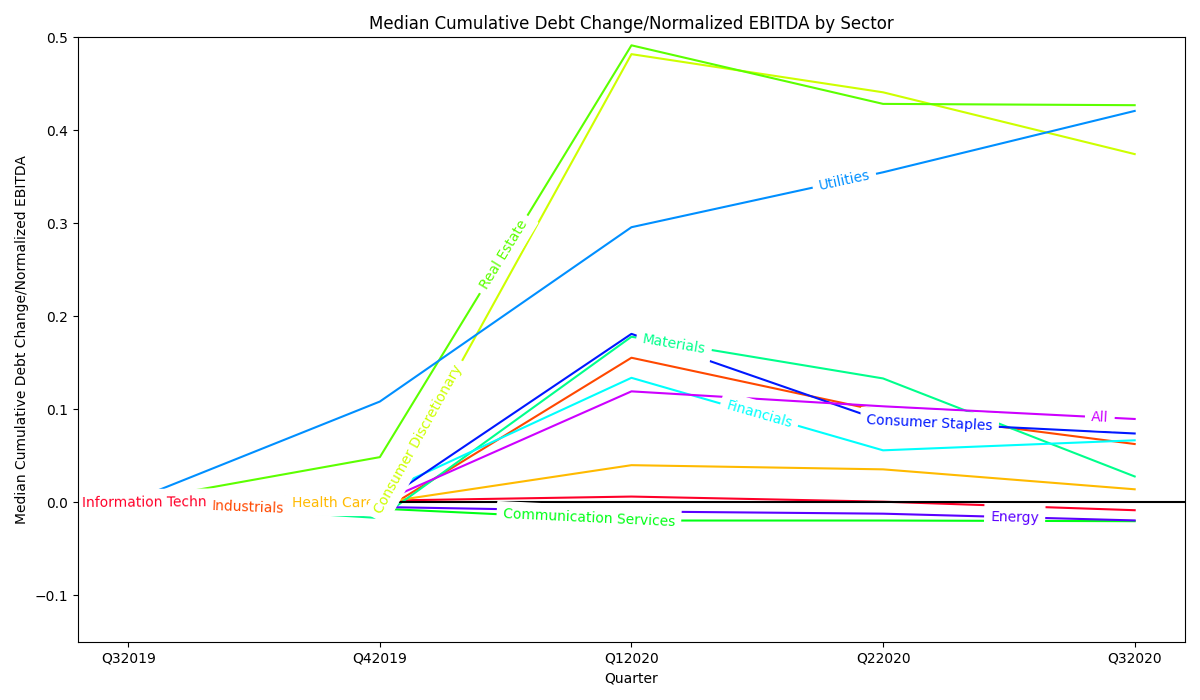
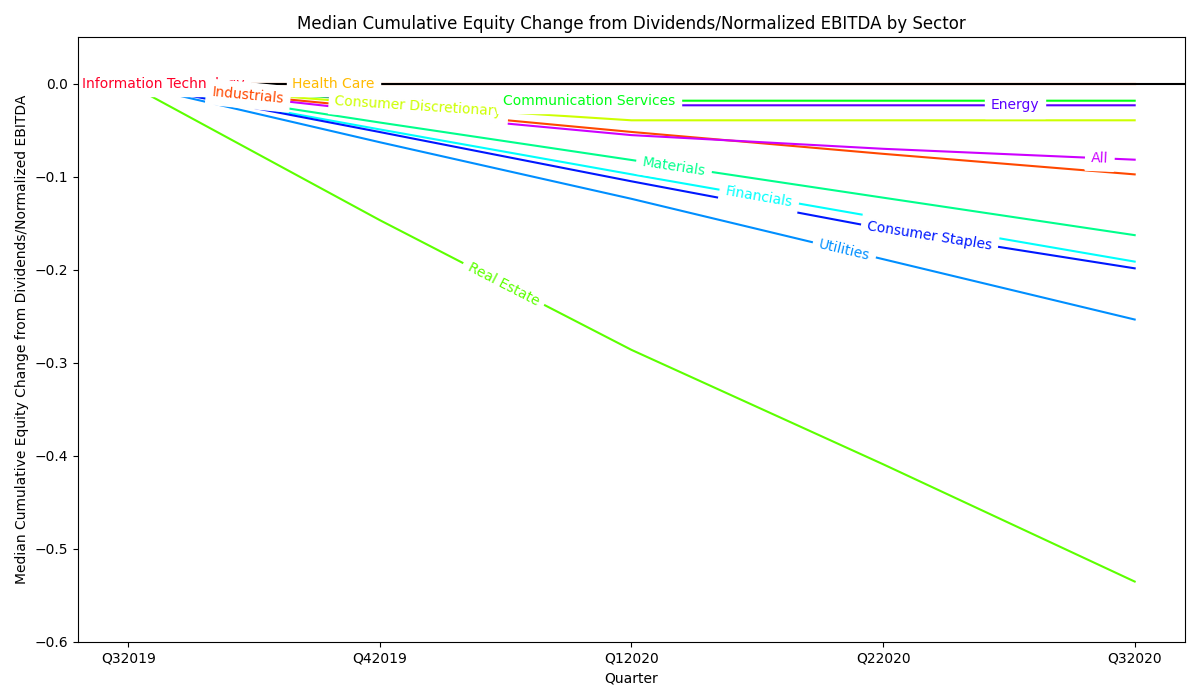
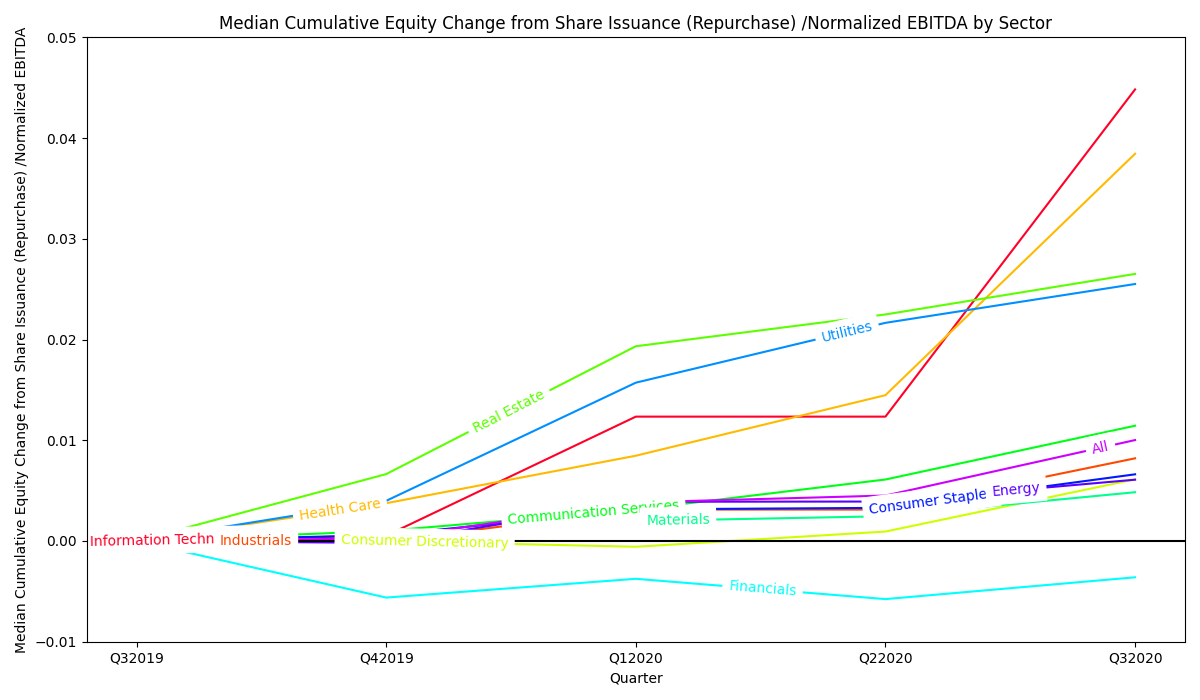
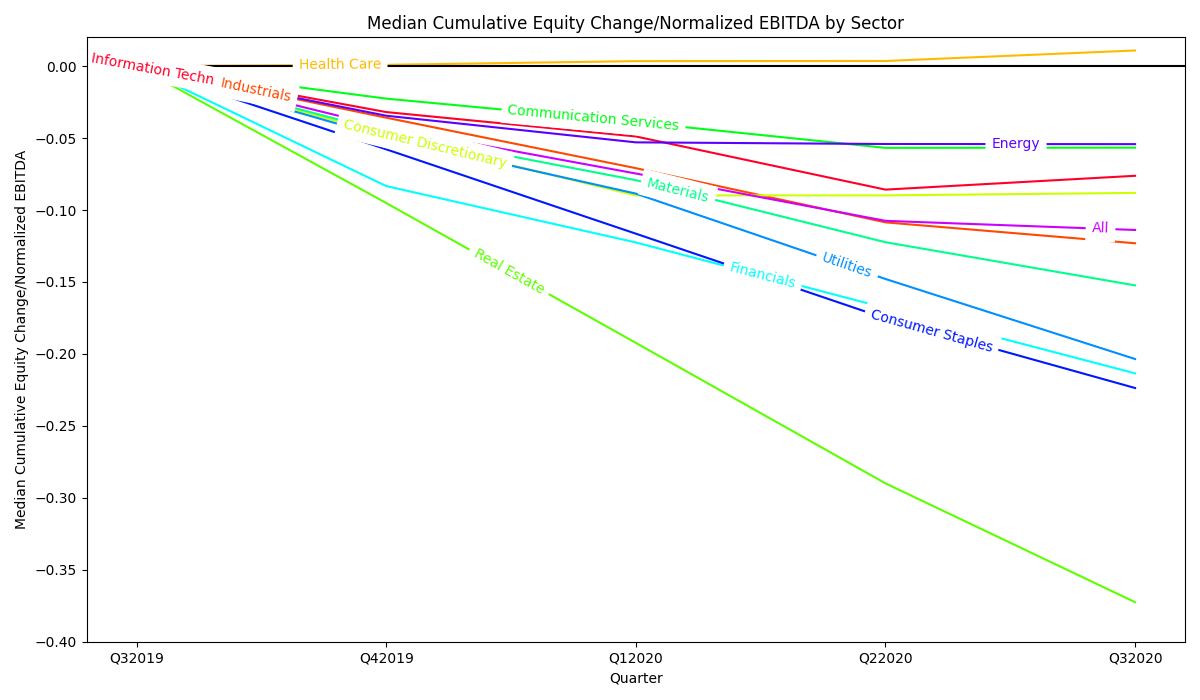
One key takeaway from the above charts is that although some firms are issuing a substantial amount of shares, on average the decrease in total equity attributable to dividends is much larger quarter over quarter, to the extent that firms have much less equity financed now than they did a year ago. On the debt side, in many sectors firms took on a lot of debt at the start of 2020 and have since reduced their debt amounts by quite a bit. The net result of these two effects is that the median firm today has cumulatively paid out approximately as much in dividends as it has taken on in debt over the past year.
The COVID-19 pandemic has had a profound impact on consumer habits. Particularly, travel for both business and leisure has decreased substantially as it was perceived as unsafe and other countries imposed entry restrictions, and e-commerce has grown as consumers have feared going to brick-and-mortar stores. Therefore, I decided it would be interesting to look specifically and the change in debt and equity for firms in the Airlines, Hotels Resorts & Cruise Lines, and Internet & Direct Marketing Retail GICS Sub-Industries.
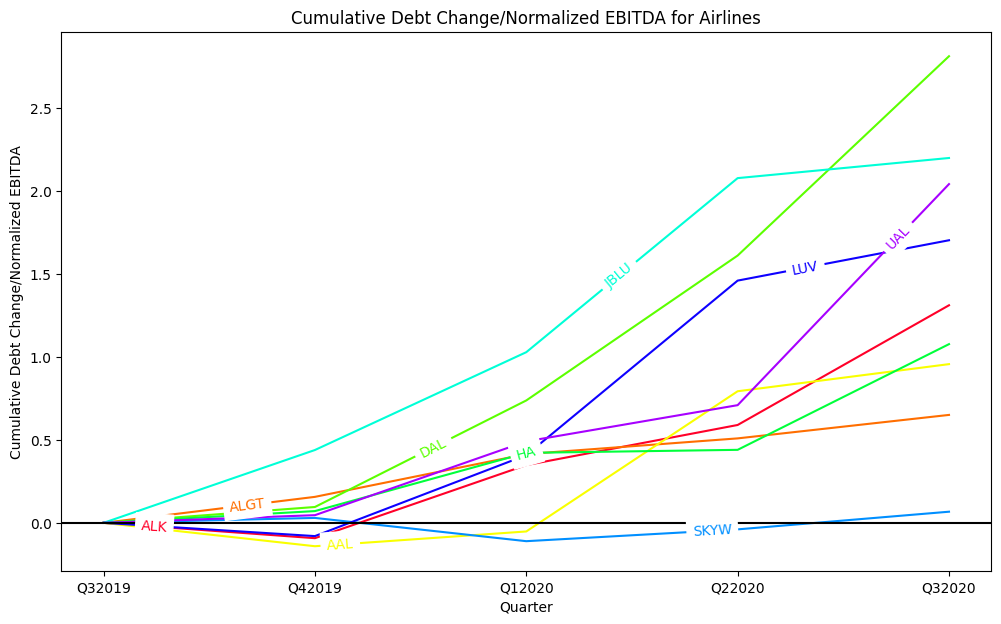
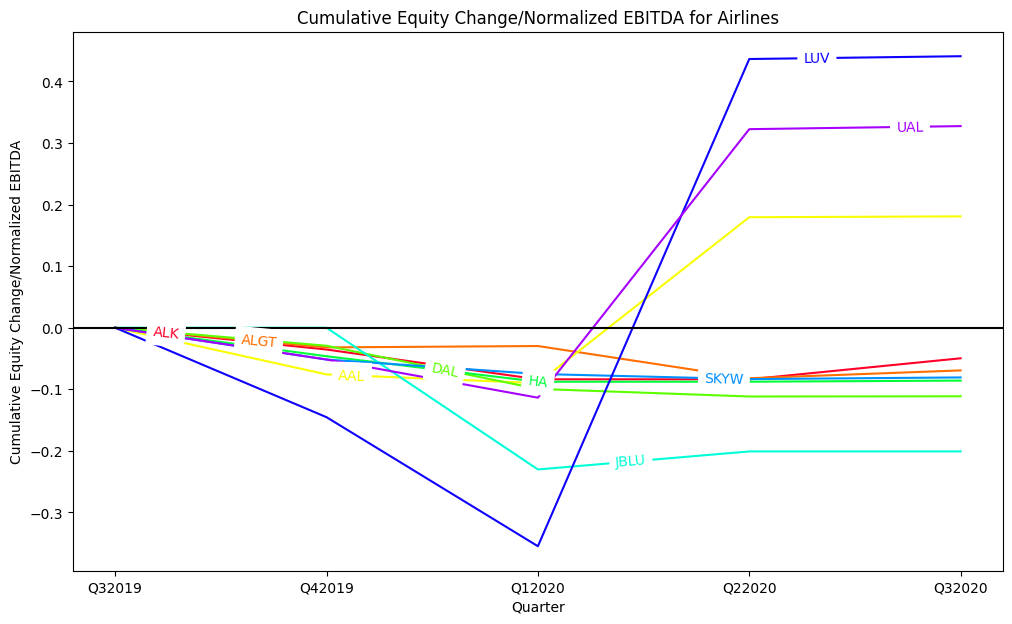
The above charts show the cumulative change in debt and equity for Airlines over the past year. While some airlines have seen a cumulative decrease in equity (largely due to payment of dividends) over the past year on the order of 0.1x annual EBITDA, some (Southwest, United, and American) have issued shares, and nearly all have taken on debt, with some (JetBlue and Delta) taking on debt in excess of 2.0x annual EBITDA over the past year. I interpret this to be a sign of financial distress for the airline industry, as they are turning to all possible avenues to raise capital rather than just re-levering. This idea is supported by the notion that, with business and leisure air travel and recent lows, airlines would feel severe amounts of financial stress.
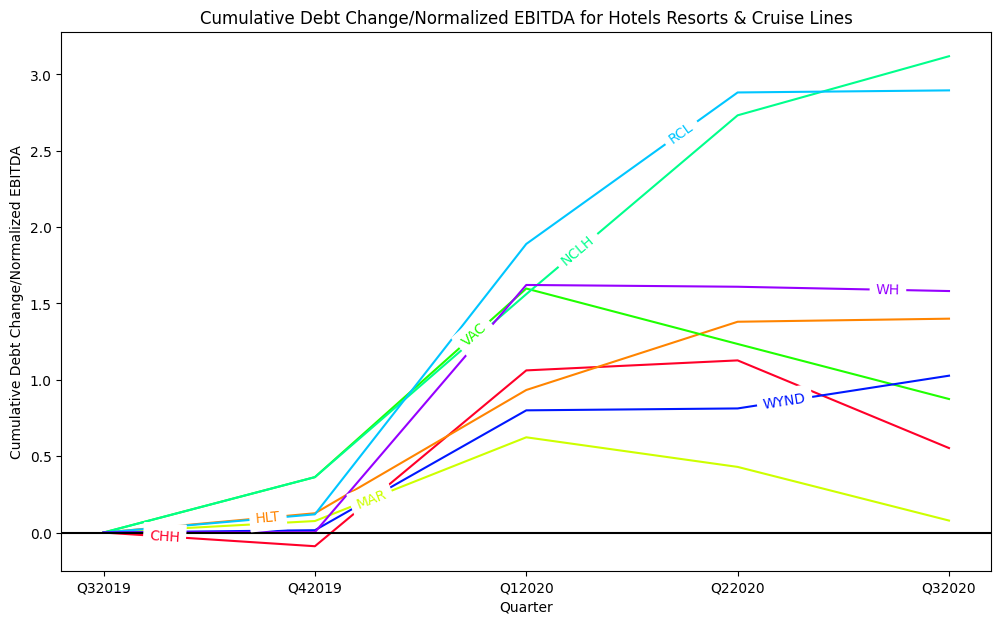
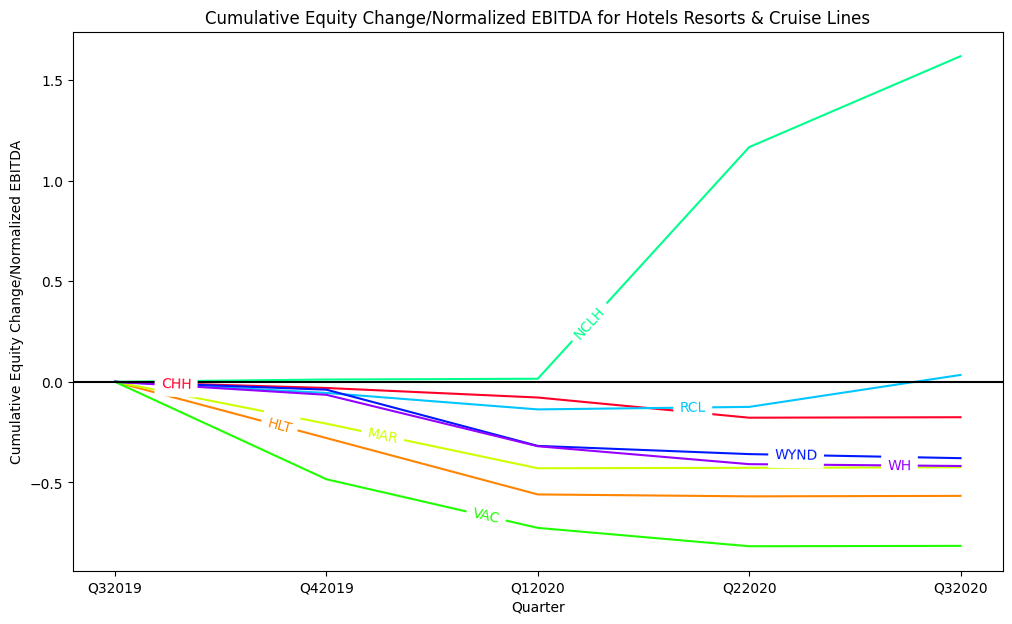
The above charts show the cumulative change in debt and equity for hotels, resorts, and cruise lines over the past year. Dividends were paid by many firms in Q4 2019 and Q1 2020 but did not make payments in Q2 and Q3 2020. There was also lots of debt accumulation in Q1 2020, likely due to the lower cost of borrowing. While some companies in this sub-industry kept debt level for the past two quarters, cruise lines took on even more debt in Q2 and Q3, while some companies were able to pay a little off like Marriott and Choice Hotels. The reduction in debt for hotel chains could be attributable to just maturing obligations, or could be due to the fact that of all the travel related categories, hotels are able to best cope with the reduced demand because they can take advantage of trends like increases in road tripping and domestic travel, can cope with decreased business travel, and can maintain a standard of cleanliness better than airlines or cruise lines. Some firms, like the cruise lines, did issue shares in addition to taking on more debt, possibly because it is hard to get good rates on all offered debt due to intrinsic business risk. Eventually it becomes cheaper to issue more shares than to take on debt. For all firms in this sub-industry, the increase in debt is much larger than the decrease in equity from dividend payments.
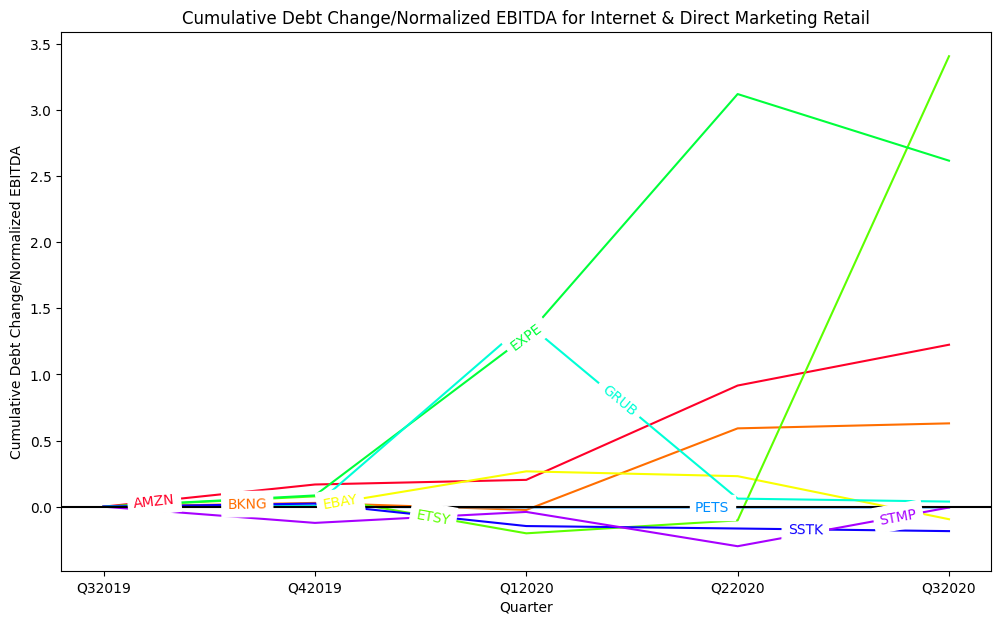
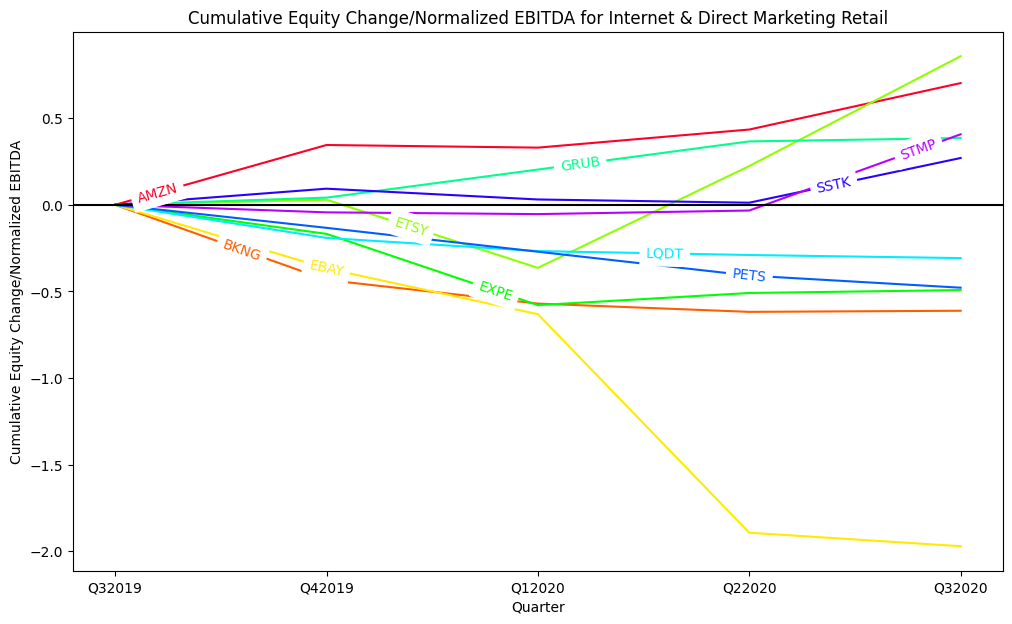
The above charts show the cumulative change in debt and equity for internet & direct marketing retail. Based on the charts, the typical internet & direct marketing retail firm did not need to take on much debt, but companies that rely on travel (like Expedia) did. Some companies issued quite a lot of shares. Amazon, for example, likely issued shares in addition to issuing debt because their share price is so high that they can get a lot of value for issuing shares without diluting their equity by much. Meanwhile, eBay bought back shares in Q1 2020 before the pandemic hit in connection with their sale of Stubhub.3 It makes sense that eBay has not further changed their capital structure since the share repurchase, as they are a firm that would be expected to maintain stability during the pandemic; as more people have free time and need extra cash they might turn to eBay to make extra cash. The typical firm in this sub-industry did not change their capital structure much, probably because this is a stable sub-industry that benefited marginally from COVID but ultimately received little impact.
The data support the idea that firms would take advantage of low interest rates and take on more debt while continuing to pay out dividends. On the scale of the whole market, this seems to be what happened, which could be interpreted as a signal that the average firm has financially not reacted much to any direct effects of the pandemic, and instead has reacted to governmental intervention like the lowering of rates that came at the same time the pandemic hit. Sub-industries that are directly and negatively affected by changing consumer behavior due to the pandemic, such as airlines, hotels, resorts, and cruise lines, have both taken on debt and issued shares. This supports the notion that if rates are low, firms would take on as much debt as they can until it is cheaper to take on equity, and then if they still need more cash to obtain it through issuing shares. This excess need for cash could be interpreted as a signal that these firms are in a state of financial distress, as they needed cash but were not able to get sufficient cash at efficient interest rates and/or feel unconfident in their future ability to pay off debt. Therefore, I believe there could be a high correlation between share issuance and financial distress, at least during the COVID-19 pandemic.
Table 1: Median change in Total Debt/normalized EBITDA by GICS sector
| Sector | Q4 2019 | Q1 2020 | Q2 2020 | Q3 2020 |
|---|---|---|---|---|
| Information Technology | 0.001699 | 0.004405 | -0.00549 | -0.00918 |
| Industrials | -0.01069 | 0.166091 | -0.05794 | -0.03483 |
| Health Care | -0.00067 | 0.040541 | -0.00449 | -0.02144 |
| Consumer Discretionary | -0.00807 | 0.489982 | -0.04103 | -0.06646 |
| Real Estate | 0.048516 | 0.442896 | -0.06299 | -0.0014 |
| Communication Services | -0.00684 | -0.01282 | 0 | -0.00071 |
| Materials | -0.01702 | 0.195016 | -0.04485 | -0.10540 |
| Financials | 0.008991 | 0.124829 | -0.07798 | 0.010772 |
| Utilities | 0.108293 | 0.187507 | 0.059072 | 0.065971 |
| Consumer Staples | -0.00116 | 0.182255 | -0.09389 | -0.01325 |
| Energy | -0.00509 | -0.00478 | -0.00242 | -0.00726 |
| All | -0.0005 | 0.119759 | -0.01608 | -0.01362 |
Table 2: Median change in Equity Value/normalized EBITDA by GICS sector
| Sector | Q4 2019 | Q1 2020 | Q2 2020 | Q3 2020 |
|---|---|---|---|---|
| Information Technology | -0.03194 | -0.01694 | -0.03695 | 0.009607 |
| Industrials | -0.03584 | -0.03507 | -0.03766 | -0.01453 |
| Health Care | 0.00089 | 0.002572 | 9.39E-05 | 0.007305 |
| Consumer Discretionary | -0.04768 | -0.04215 | 0 | 0.001719 |
| Real Estate | -0.09512 | -0.09719 | -0.09762 | -0.0826 |
| Communication Services | -0.02259 | -0.01632 | -0.0179 | 0.000151 |
| Materials | -0.04594 | -0.03332 | -0.04311 | -0.02999 |
| Financials | -0.08336 | -0.03918 | -0.04553 | -0.04543 |
| Utilities | -0.04978 | -0.03882 | -0.05933 | -0.05562 |
| Consumer Staples | -0.05783 | -0.05861 | -0.05884 | -0.04841 |
| Energy | -0.03447 | -0.01851 | -0.00115 | -0.0001 |
| All | -0.04269 | -0.03195 | -0.03288 | -0.00635 |
Table 3: Median change in Equity Value attributable to dividend payments/normalized EBITDA by GICS sector
| Sector | Q4 2019 | Q1 2020 | Q2 2020 | Q3 2020 |
|---|---|---|---|---|
| Information Technology | 0 | 0 | 0 | 0 |
| Industrials | -0.0264 | -0.02535 | -0.02354 | -0.02211 |
| Health Care | 0 | 0 | 0 | 0 |
| Consumer Discretionary | -0.02188 | -0.01735 | 0 | 0 |
| Real Estate | -0.14663 | -0.13949 | -0.123 | -0.12618 |
| Communication Services | -0.01815 | 0 | 0 | 0 |
| Materials | -0.04163 | -0.04027 | -0.04052 | -0.04032 |
| Financials | -0.04906 | -0.04826 | -0.04731 | -0.04657 |
| Utilities | -0.06283 | -0.06083 | -0.0649 | -0.06492 |
| Consumer Staples | -0.05186 | -0.05298 | -0.05091 | -0.04268 |
| Energy | -0.01709 | -0.006 | 0 | 0 |
| All | -0.03009 | -0.02506 | -0.01472 | -0.0117 |
Table 4: Median change in Equity Value attributable to share issuance or repurchase/normalized EBITDA by GICS sector
| Sector | Q4 2019 | Q1 2020 | Q2 2020 | Q3 2020 |
|---|---|---|---|---|
| Information Technology | 0.000529 | 0.011817 | 0 | 0.032484 |
| Industrials | 0 | 0.003118 | 0 | 0.005088 |
| Health Care | 0.003751 | 0.004714 | 0.006012 | 0.023967 |
| Consumer Discretionary | -9.94E-06 | -0.00056 | 0.001511 | 0.005185 |
| Real Estate | 0.006641 | 0.01269 | 0.003157 | 0.004024 |
| Communication Services | 0.001007 | 0.002108 | 0.002989 | 0.005337 |
| Materials | 0 | 0.001979 | 0.000479 | 0.002383 |
| Financials | -0.00562 | 0.001863 | -0.00202 | 0.002165 |
| Utilities | 0.003989 | 0.011728 | 0.00594 | 0.003855 |
| Consumer Staples | 0.000586 | 0.002553 | 0.000153 | 0.003327 |
| Energy | -0.00019 | 0.004086 | 2.24E-05 | 0.002168 |
| All | 0.000258 | 0.003568 | 0.000685 | 0.005508 |
The following is an example of the database schema used to store final change in debt to normalized EBITDA ratios used:
CREATE TABLE debt_cng_ebd
  (
     symbol TEXT UNIQUE,
     q42019 FLOAT DEFAULT NULL,
     q12020 FLOAT DEFAULT NULL,
     q22020 FLOAT DEFAULT NULL,
     q32020 FLOAT DEFAULT NULL
  );
A similar structure was used for the change in equity to normalized EBITDA ratios, change in equity attributable to dividends paid to normalized EBITDA ratios, and change in equity attributable to share repurchase (issuance) to normalized EBITDA ratios.
The following is an example of the python code used to retrieve the median debt change to normalized EBITDA ratio for each GICS sector. A similar code fragment was used for other database queries.
for sector in unique_sectors:
    cur.execute("SELECT * "
                "FROM   debt_cng_ebd "
                "       INNER JOIN gics "
                "       ON debt_cng_ebd.symbol = gics.symbol "
                "WHERE gics.sector=?", [sector])
    rows = cur.fetchall()
    meds[sector] = {quarter: statistics.median([row[quarter]
                                                for row in rows
                                                if row[quarter] is not None])
                    for quarter in model.quarters}
The above Python code has an embedded SQL query. Here is just that query alone:
SELECT *
FROM   debt_cng_ebd
       INNER JOIN gics
               ON debt_cng_ebd.symbol = gics.symbol
WHERE gics.sector = industrialsThe following is an example of the Python code that uses Matplotlib to generate a bar chart showing the median debt change to normalized EBTIDA for each GICS sector for each quarter in study. Similar code was used for other bar charts in this report.
x = numpy.arange(len(dct))
width = 0.2
fig, ax = plt.subplots()
q4 = ax.bar(x - 1.5*width, [dct[comp][model.quarters[0]]
                            for comp in dct], width, label=model.quarters[0])
q1 = ax.bar(x - 0.5*width, [dct[comp][model.quarters[1]]
                            for comp in dct], width, label=model.quarters[1])
q2 = ax.bar(x + 0.5*width, [dct[comp][model.quarters[2]]
                            for comp in dct], width, label=model.quarters[2])
q3 = ax.bar(x + 1.5*width, [dct[comp][model.quarters[3]]
                            for comp in dct], width, label=model.quarters[3])
ax.axhline(color='black')
for i in range(len(dct) - 1):
    ax.axvline(x=0.5 + i, linestyle='dashed', color='green')
ax.set_ylabel(f'{label}')
ax.set_title(f'{label} for {cat}')
ax.set_xticks(x)
ax.set_xticklabels(dct.keys())
fig.autofmt_xdate()
ax.legend()The following is an example of the Python code that uses Matplotlib to generate a line chart showing the cumulative median debt change to normalized EBTIDA for each GICS sector for each quarter in study. Similar code was used for other line charts in this report.
quarters = ['Q32019'] + list(model.quarters)
NUM_COLORS = len(dct)
cm = plt.get_cmap('gist_rainbow')
fig = plt.figure()
ax = fig.add_subplot(111)
ax.set_prop_cycle('color', [cm(1.*i/NUM_COLORS) for i in range(NUM_COLORS)])
plt.xticks(numpy.arange(5), quarters)
for comp in dct:
    plt.plot(range(5), [0] + [sum(list(dct[comp].values())[:(i+1)])
                              for i in range(len(model.quarters))],  label=comp)
plt.xlabel('Quarter')
ax.axhline(color='black')
plt.ylabel(f'Cumulative {label}')
plt.title(f'Cumulative {label} for {cat}')To run this project on your machine, first clone the repository:
git clone https://github.com/japplefield/fin342-corp-structureChange into the cloned directory and create a virtual environment and install the required libraries:
cd fin342-corp-structure/
python -m venv env
source env/bin/activate
pip install -r requirements.txt
Next, simply run the gen_graphs script:
./gen_graphs.shTo generate the database without generating graphs, run the file_import script:
./file_import.pyTo generate graphs for any GICS grouping, you can run the generic script as follows:
./generic.py <gics type> <gics classification>It is strongly recommended to only use this for GICS Industries or Sub Industries. Trying to use this script for GICS Sectors or Industry Groups will result in graphs with too many companies that are difficult to interpret. GICS type should be entered as a single word joined by underscores (i.e. Sector, Industry_Group, Industry, and Sub_Industry), while GICS classification should be entered as a quoted string with no commas (e.g. 'Hotels Resorts & Cruise Lines')