vis is a CLI for visualizing fuzzy tabular data without leaving the terminal.
![]()
vis provides quick, on-the-fly visualizations of tabular data that may not be perfectly structured. Whether it's output from a command, log file, messy CSV, or more, vis can parse and visualize it with a short one-liner.
- Visualize 1D data as histograms and 2D data as scatter/line plots, via Matplotlib and Seaborn
- Fuzzy parsing extracts numbers from messy data, no strict columns or formats required
- Units and time parsing gracefully converts human-friendly formats like
5GB,2h30m,3 days ago - Boundary control with options to filter outliers or set axis limits
- Trend lines and KDE for deeper insights into data distributions and relationships
- Clean-only mode to just extract and print the parsed numbers without plotting, perfect for data cleaning
pip install vis_cliawk 'BEGIN { for (i = 0; i < 1000; i++) print rand() * 100 }' | vis hist --kde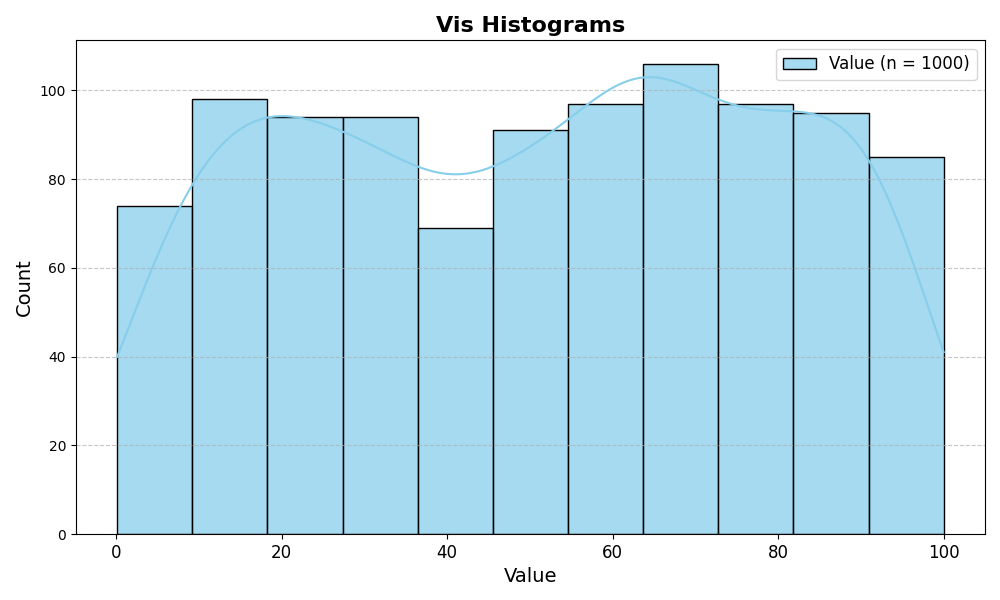
echo -e 'messy 1 data2\nstill1.5results3\n2 1 in\n3 1.5\n2clean2 outputs' | vis scatter --trend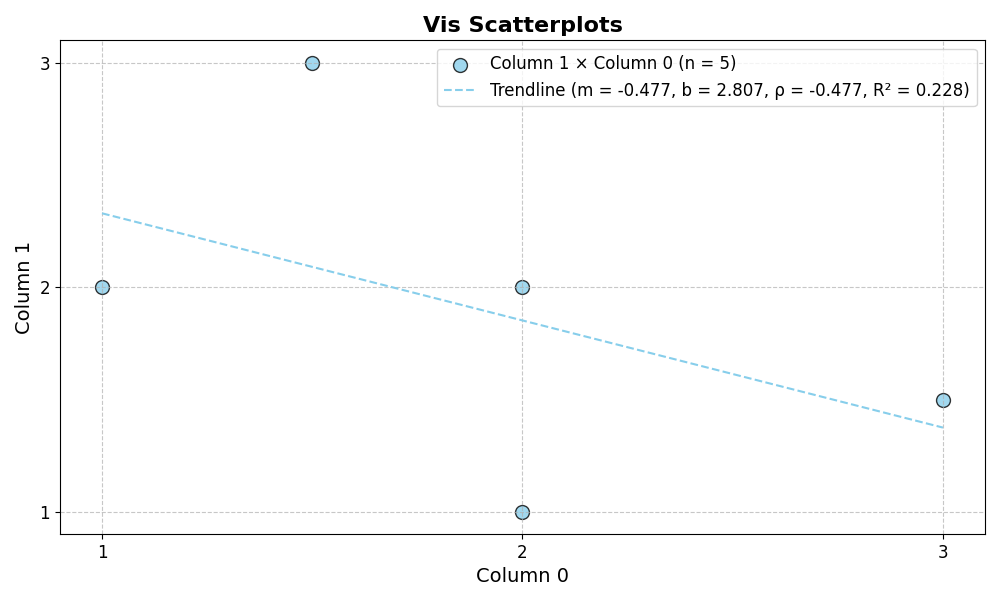
seq 0 0.1 10 | awk '{print $1, sin($1)}' | vis line --xlab "Time" --ylab "sin(t)"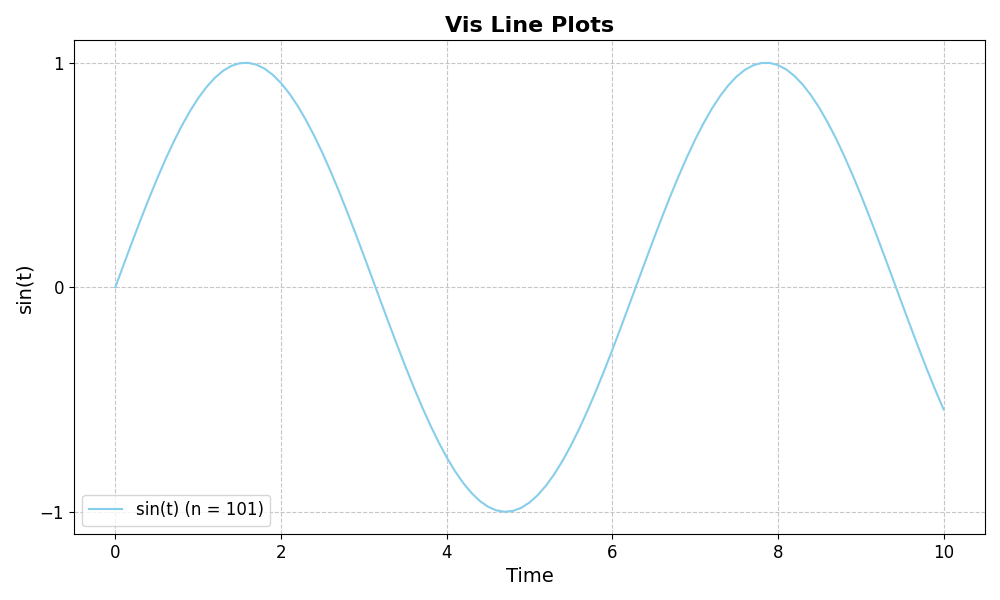
kubectl get pods --all-namespaces | vis hist --col 5 --sep ' ' --unit day --kde --xlab 'Pod age (days)'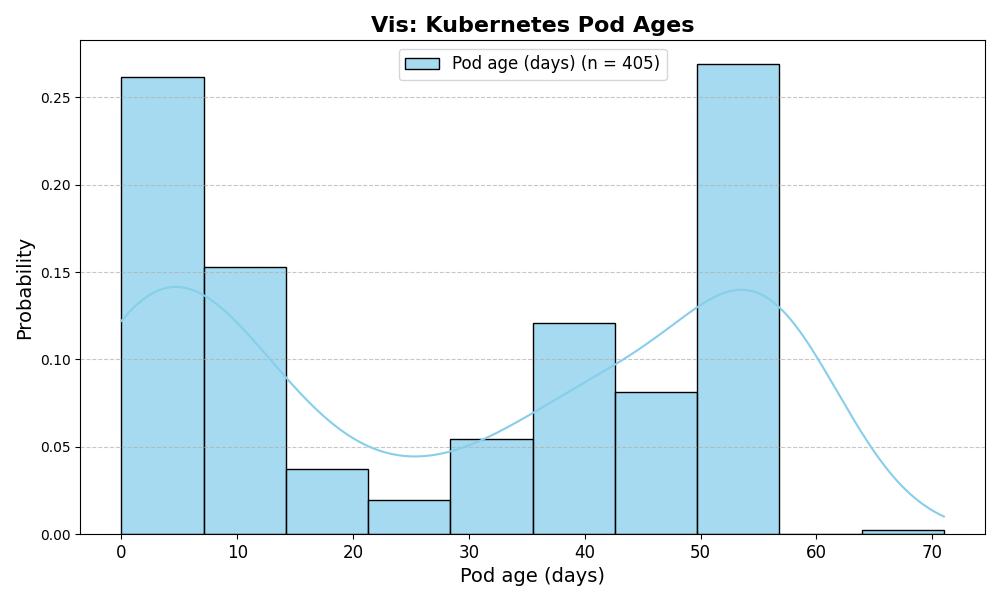
kubectl top nodes | vis hist --static --col 2 --bins 10 --xmax 100 --xlab 'CPU util' --kde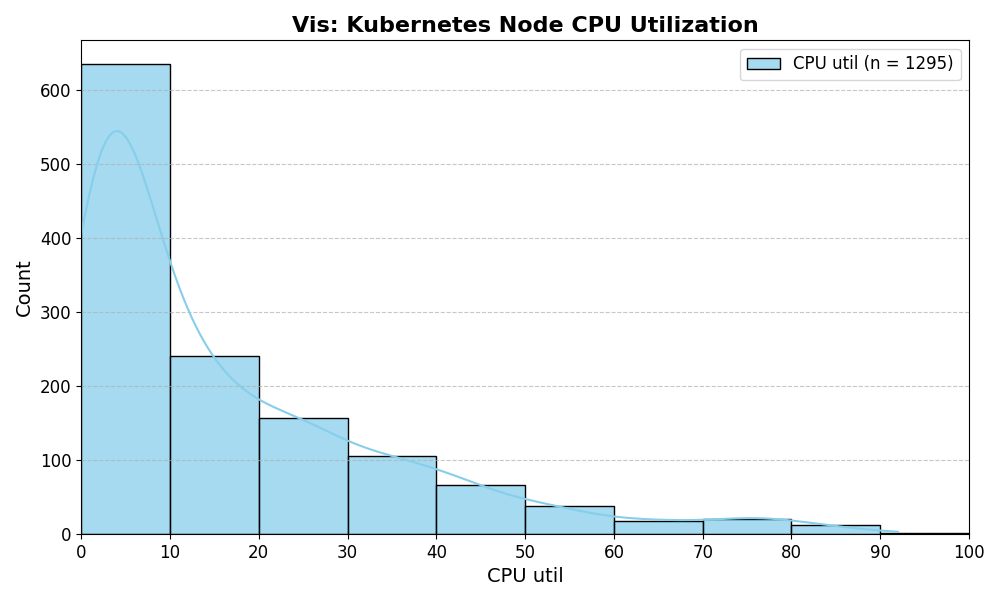
kubectl resource-capacity --pods | grep -v '\*.*\*' | vis scatter --static --cols 4 6 --xlab "CPU limits" --ylab "Memory limits" --trend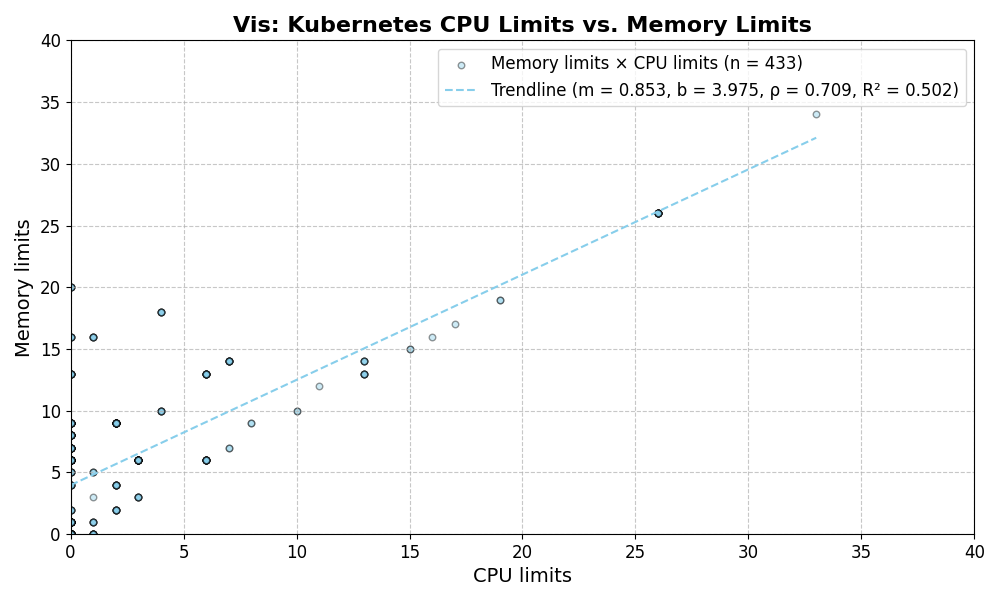
$ vis --help
Usage: vis [OPTIONS] COMMAND [ARGS]...

  A fuzzy tabular data visualization tool.

Options:
  -h, --help  Show this message and exit.

Commands:
  clean    Clean the data from a file or stdin and print it to stdout.
  hist     Create a histogram from tabular data.
  line     Create a line plot from tabular data.
  scatter  Create a scatter plot from tabular data.
$ vis hist --help
Usage: vis hist [OPTIONS]

  Create a histogram from numerical data.

Options:
  --bins INTEGER                  Number of bins for the histogram.  [default: 0]
  -f, --file TEXT                 Path to the input file. Defaults to stdin.  [default: -]
  --save                          Save the plot to file.
  --justsave                      Save the plot to file without displaying it.
  -o, --output TEXT               Output filename for the plot. Implies --save.
  --xlab TEXT                     Label for the x-axis.  [default: Value]
  --ylab TEXT                     Label for the y-axis.
  --title TEXT                    Title for the plot.
  --col INTEGER                   Column index to plot.  [default: 0]
  --static                        Use cols to index into columns instead of list of floats.
  --sep TEXT                      Separator for the input columns. Implies --static.
  --xmin TEXT                     Filter x-axis values below.
  --xmax TEXT                     Filter x-axis values above.
  --barcolor TEXT                 Color for the histogram bars.
  --baredge TEXT                  Edge color for the histogram bars.
  --baralpha FLOAT                Alpha value for the histogram bars.
  --stat [count|freq|prob|percent|density]
                                  Statistical measure to display in the histogram.  [default: Count]
  --step INTEGER                  Step size for x-axis ticks.
  --kde                           Add a kernel density estimate (KDE) to the histogram.
  --unit [sec|min|hour|day]       Coerce output to a specific unit. Implies --static.
  --time                          Parse input and x-axes as datetimes.
  --strict                        Fail on parse errors instead of skipping them.
  --force                         Overwrite the output file if it exists.
  --verbose                       Print verbose output.
  -h, --help                      Show this message and exit.
I mainly use vis to investigate issues in Kubernetes clusters.
kubectl get pinapps | vis hist --col 2 --sep ' 'kubectl get pinterestjobset | vis hist --time --col 1 --sep ' ' --xmax '1 week ago'