This project performs Sentiment Analysis on X/Twitter data to gauge public perception and emotional tone regarding flood risk in Ghana's Greater Accra Region. By scraping and analyzing tweets containing flood-related keywords, this study categorizes public sentiment into Positive, Negative, and Neutral classes. The goal is to provide insights into community concerns, government response perceptions, and overall social vulnerability, complementing traditional geospatial flood risk models with human-centric data.
The analysis focuses on public discourse surrounding flooding in the Greater Accra Region, Ghana's capital and most densely populated area. This region is highly vulnerable to flooding due to its:
- Low-lying coastal plains
- Rapid urbanization
- Inadequate drainage infrastructure
- Frequent heavy rainfall events
Understanding public sentiment here is crucial for effective disaster communication, policy-making, and community engagement strategies.
- Source: X (formerly Twitter)
- Method: Data was scraped using third-party tools (Twitter Scraper & Twitter Scraper V2) on Apify.com.
- Keywords: Tweets were collected using flood-related buzzwords and specific location names (e.g.,
"Weija flood","Adabraka flood","Tse Addo flood","Kaneshie flood","Odaw drain"). - Dataset: 1,232 publicly accessible user tweets were collected and downloaded in CSV format.
- Data Fields: The dataset includes:
tweet(text content)author username,location,descriptiondateof tweet- Engagement metrics (
likes count,retweets) - Author account details (
followers,following,account creation date)
Raw tweet data contains noise that must be cleaned for accurate analysis. The following preprocessing steps were implemented in Python using libraries like pandas, nltk, and re:
- Removal of Irrelevant Columns: Focus was placed solely on the tweet text (
tweetcolumn). - Text Cleaning: A custom function was defined to:
- Convert text to lowercase.
- Remove URLs, user mentions (@), and hashtags (#).
- Remove punctuation and non-word characters.
- Tokenize text (split into individual words).
- Remove stop words (e.g., "the", "and", "is") using the NLTK corpus.
- Stemming: Words were reduced to their root form using the Porter Stemmer algorithm (e.g., "flooding" -> "flood") to normalize the vocabulary.
- Deduplication: Duplicate tweets were removed to prevent skewing the results.
- Tool: The
TextBloblibrary was used for initial sentiment polarity scoring. - Scoring: Each tweet was assigned a
polarityscore between -1 (Very Negative) and +1 (Very Positive). - Categorization: Tweets were classified into three categories based on their polarity score:
- Negative: polarity < 0
- Neutral: polarity = 0
- Positive: polarity > 0
To improve classification robustness, two machine learning models were trained and evaluated.
- Feature Extraction: The cleaned text was vectorized using
CountVectorizer, which transforms text into a matrix of token counts. - Models Used:
- Logistic Regression
- Linear Support Vector Classifier (Linear SVC)
- Training: The dataset was split into a training set (80%) and a testing set (20%).
- Hyperparameter Tuning:
GridSearchCVwas used to find the optimal parameters for each model.
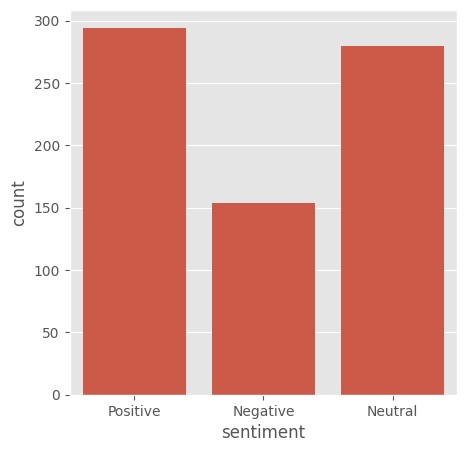
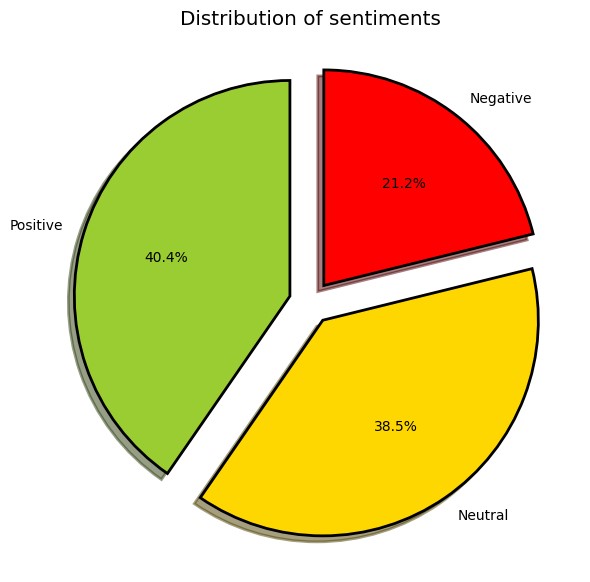
Initial analysis with TextBlob revealed the distribution of sentiments across the collected tweets, visualized through bar graphs and pie charts. ![Sentiment Distribution]
The machine learning models achieved moderate accuracy, highlighting the challenge of classifying social media text, which is often short, informal, and context-dependent.
| Model | Accuracy | Precision (Weighted Avg) | Recall (Weighted Avg) | F1-Score (Weighted Avg) |
|---|---|---|---|---|
| Logistic Regression | 58.90% | 0.61 | 0.59 | 0.55 |
| Linear SVC | 60.00% | 0.62 | 0.60 | 0.57 |
Key Findings:
- The Neutral class had the highest recall (~0.86), meaning the model was best at correctly identifying neutral tweets.
- The Negative class had the lowest recall (~0.23-0.29), indicating the model often misclassified negative tweets as neutral or positive.
- The Positive class was the most challenging, showing lower precision and recall scores. Manual inspection revealed that many "positive" tweets were actually about government promises and plans to combat flooding, which were hopeful in tone but contextually related to a negative event.
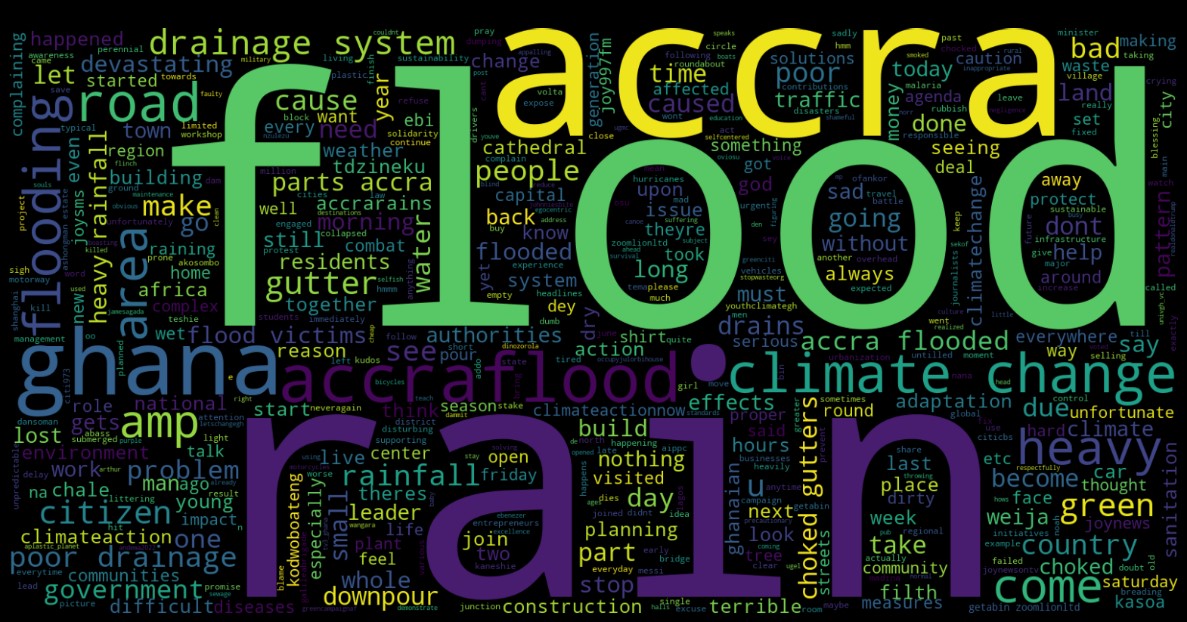
- Word Clouds: Generated for each sentiment class to visualize the most frequent words in Negative, Positive, and Neutral tweets. [Word Cloud for Negative Tweets]
## 🛠️ Installation & Usage

### Prerequisites
*   **Python 3.7+**
*   Required Python libraries: Install via `pip install -r requirements.txt`
    *   `pandas`
    *   `numpy`
    *   `nltk`
    *   `textblob`
    *   `scikit-learn`
    *   `matplotlib`
    *   `wordcloud`

### Running the Analysis
1.  **Clone the repository** and navigate to the project directory.
2.  **Install the required packages** (see above).
3.  **Place your raw Twitter data** in the `Data/Raw/` folder.
4.  **Run the main script:**
    ```bash
    python Scripts/Twitter sentiment analysis for flooding in the Greater Accra Region of Ghana.py
    ```
5.  The script will output:
    *   Cleaned data files
    *   Visualizations of sentiment distribution
    *   Performance metrics and confusion matrices for the ML models

## 🎯 Conclusions & Insights

*   **Public Discourse:** The analysis captured a mix of frustration (negative), factual reporting (neutral), and discussion of solutions (positive) related to flooding in Accra.
*   **Model Limitations:** Achieving high accuracy (~60%) with standard ML models on social media text is challenging due to sarcasm, irony, and complex context. For example, tweets with a positive tone discussing government action were often rooted in a negative flooding event.
*   **Value of Integration:** This sentiment data provides crucial qualitative context to quantitative geospatial flood models, highlighting areas where public concern is highest and where communication efforts might be needed most.

## 🔮 Future Work

*   **Advanced NLP Techniques:** Utilize pre-trained transformer models like BERT or RoBERTa for more context-aware sentiment classification.
*   **Aspect-Based Sentiment Analysis:** Move beyond overall sentiment to identify specific aspects people are talking about (e.g., sentiment on "drainage," "government response," "property damage").
*   **Temporal Analysis:** Scrape data over a longer period to analyze how sentiment shifts before, during, and after major flood events.
*   **Geolocation Integration:** Map sentiments to specific locations within Greater Accra (where possible) to create a spatial sentiment layer.
*   **Multi-Platform Analysis:** Incorporate data from other social media platforms like Facebook and Instagram for a more comprehensive view.


## 🙏 Acknowledgments

- Data sourced via [Apify](https://apify.com/) from X (Twitter).
- The `nltk` and `scikit-learn` communities for providing robust NLP and ML tools.