A portable, offline application to create beautiful charts from CSV files using Plotly. Works on Windows, macOS, and Linux with Docker.
- 📈 Multiple Chart Types: Bar, Line, Scatter, Pie, and Area charts
- 🎨 Customizable Styling:
- Multiple color palettes
- Custom backgrounds (White, Black, Transparent)
- Adjustable text colors and labels
- 💾 Export Options: PNG, JPEG, SVG, and PDF formats
- 📦 Batch Processing: Export all charts at once
- 🌐 Bilingual: English and Portuguese (PT) interface
- 🔒 Offline: Works completely offline after initial setup
- 🐳 Docker-based: No Python installation required
- Docker Desktop installed and running
- Any modern web browser
-
Clone or download this repository
git clone https://github.com/brunurb/plotly-chart-maker-offline.git cd plotly-chart-maker-offline -
Make the run script executable
chmod +x run.sh
-
Run the application
./run.sh
-
Access the app
- Your browser will open automatically to
http://localhost:8501 - Or manually navigate to
http://localhost:8501
- Your browser will open automatically to
-
Download and extract this repository
-
Double-click
run.bat -
Access the app at
http://localhost:8501(opens automatically)
-
Clone or download this repository
git clone https://github.com/brunurb/plotly-chart-maker-offline.git cd plotly-chart-maker-offline -
Make executable and run
chmod +x run.sh
./run.sh
-
Access at
http://localhost:8501
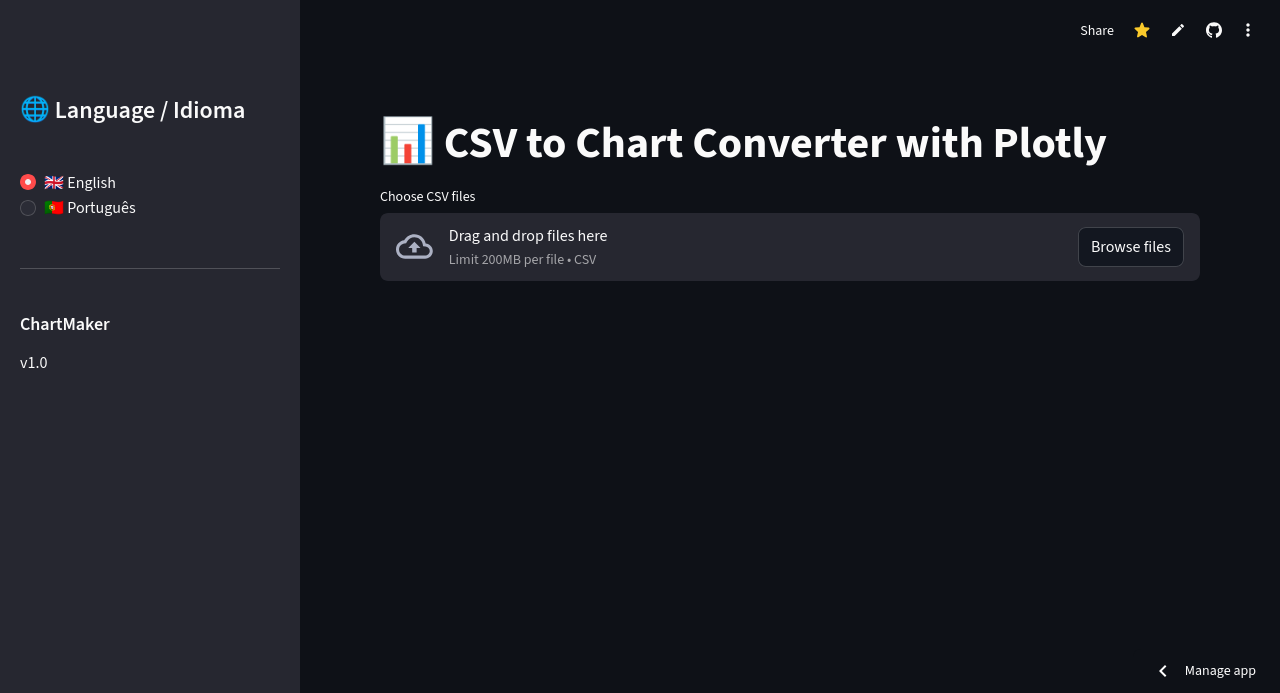
- Upload CSV files - Click "Choose CSV files" and select one or more files
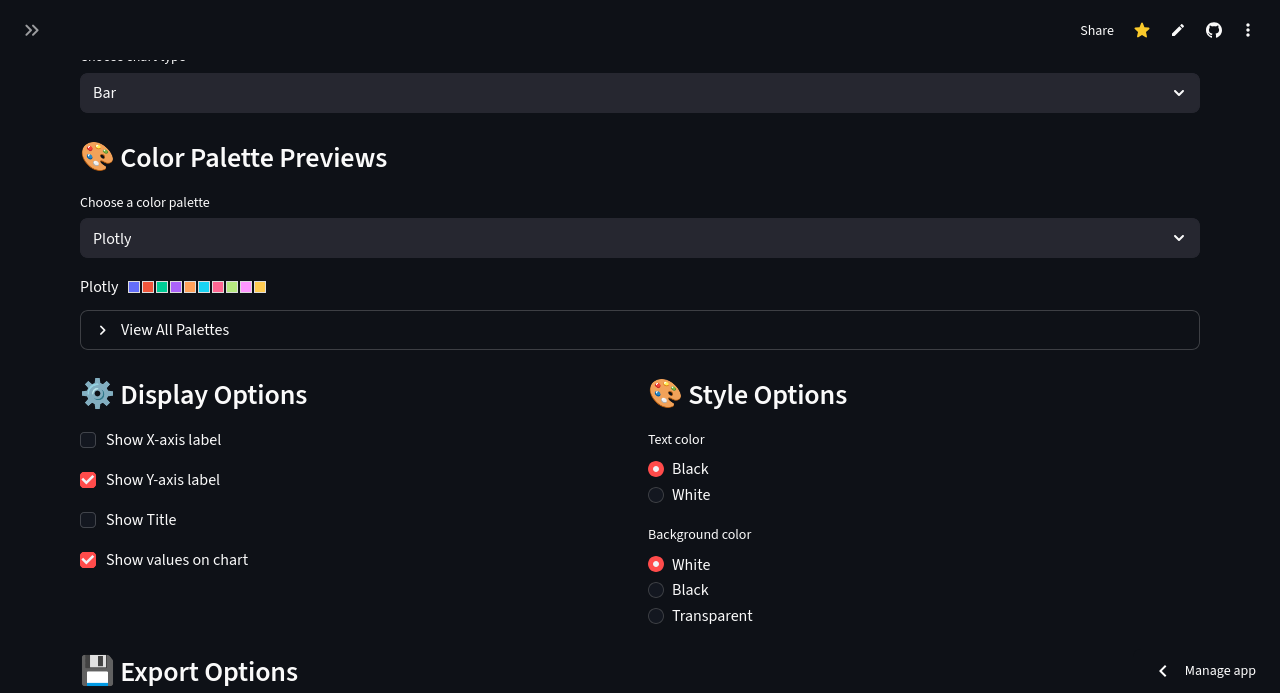
- Choose chart type - Bar, Line, Scatter, Pie, or Area
- Select color palette - Preview and choose from available palettes
- Customize appearance - Toggle labels, values, and styling options
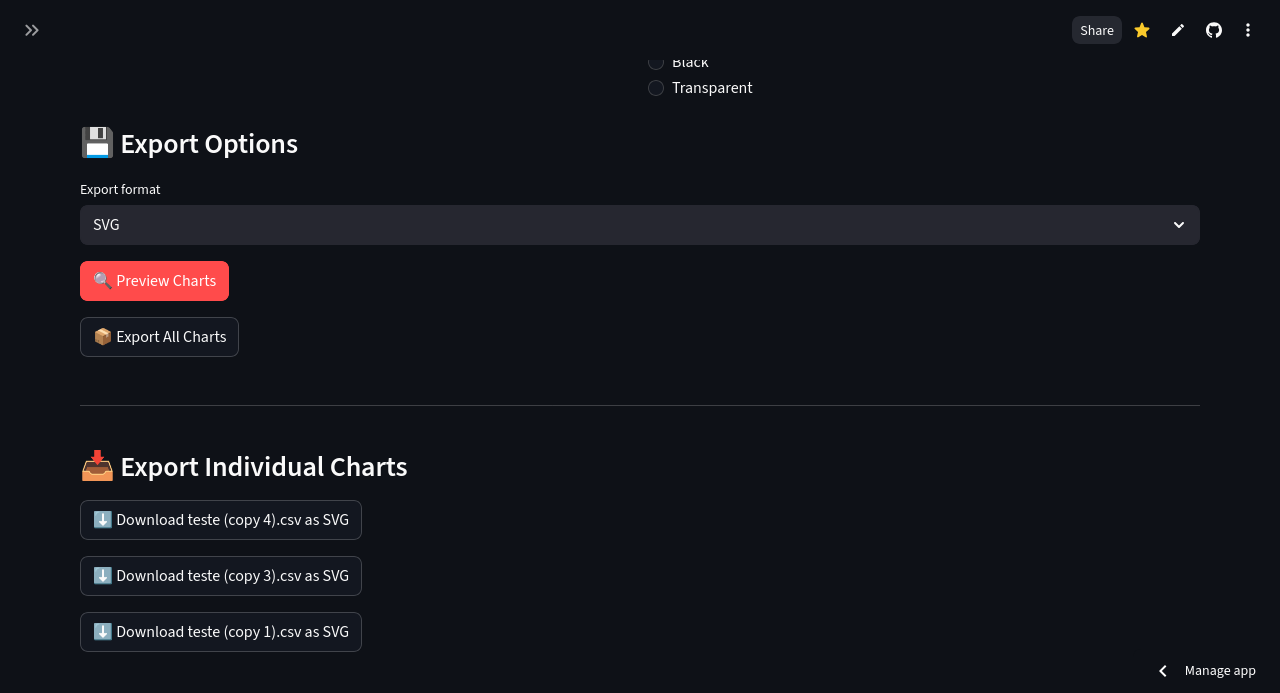
- Select export format - PNG, JPEG, SVG, or PDF
- Preview - Click "Preview Charts" to see your visualizations
- Export - Use "Export All Charts" for batch download or export individually
Your CSV files should have:
- Header row with column names
- First column: Categories/labels (e.g., location names)
- Remaining columns: Numeric data to plot
Example:
concelhos,Sim,Não,Ns/Nr
Lisboa,45,30,25
Porto,50,35,15
Faro,40,40,20- PNG: Best for presentations and documents (raster image)
- JPEG: Compressed raster image
- SVG: Best for scaling and editing (vector image)
- PDF: Best for printing and reports
Exported charts are saved in the output_charts folder in the same directory as the application.
- Streamlit - Web application framework
- Plotly - Interactive charting library
- Pandas - Data manipulation
- Kaleido - Static image export
- Docker - Containerization
The application runs in a Docker container with:
- Python 3.8
- All required dependencies pre-installed
- Persistent volume for chart exports
- Port mapping to localhost:8501
- RAM: 2GB minimum
- Disk Space: ~500MB for Docker image
- OS: Linux, Windows 7+, or macOS 10.14+
- Docker: Version 20.10 or higher
# Linux
sudo systemctl start docker

# Or start Docker Desktop on Windows/MacEdit run.sh or run.bat and change the port:
# Change this line:
docker run -p 8502:8501 ...
# Then access at http://localhost:8502# Make script executable
chmod +x run.sh
# Or run Docker without sudo (add user to docker group)
sudo usermod -aG docker $USER
# Then log out and log back in- Check the
output_chartsfolder is created - Ensure Docker has permission to write to the directory
- Try running Docker with elevated permissions
Manually navigate to: http://localhost:8501
For an online version that works without installation, visit: plotly-chart-maker-bbb.streamlit.app
This project is licensed under the MIT License - see the LICENSE file for details.
Contributions, issues, and feature requests are welcome! Feel free to check the issues page.
Bruno
- GitHub: @brunurb
⭐ If you find this project useful, please consider giving it a star!