



Python MCP server for BitDive trace analysis, request reproduction, and regression management.
This repository exposes BitDive monitoring and QA operations to MCP clients such as Cursor, Claude Desktop, and other agent runtimes. The implementation lives in server.py and connects to the BitDive Monitoring API while adding its own formatting, normalization, and comparison logic on top.
Use this repository from the
python-mcp-serverbranch.
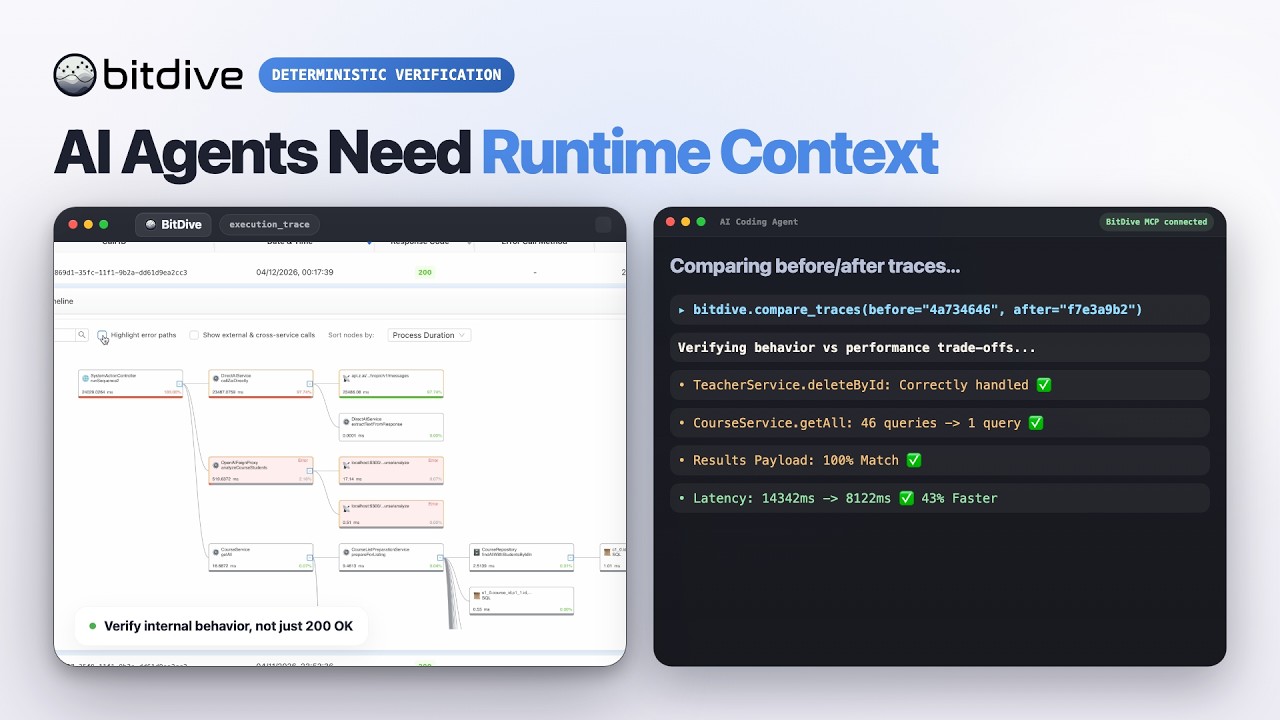
Watch the BitDive product demo on YouTube:
This server is not just a thin API proxy.
It wraps BitDive API endpoints and makes them usable for agent workflows:
- compact heatmap summaries for discovery
- readable trace summaries instead of raw JSON only
- Bash and PowerShell reproduction commands from captured requests
- before/after trace comparison with payload and contract drift reporting
- SQL normalization and volatile-field filtering to reduce noisy diffs
- automatic secret redaction and chronological child-call ordering on trace paths
- test-group inspection and regression-management flows
Use this server when an AI agent or developer needs to:
- discover which module, service, class, or entrypoint is active
- fetch recent or historical traces
- inspect a trace without manually parsing BitDive JSON
- reproduce a captured web request locally
- compare two traces after a code change
- track how behavior evolved across multiple runs
- inspect and update BitDive test groups
The current server exposes 24 MCP tools.
Tool names follow their intent: discovery tools (you do not have an id yet) start with get_*_heatmap / list_* / find_* / search_*; inspect tools (you already have a call_id) start with get_trace*; compare tools diff traces.
| Group | Tools | When to use |
|---|---|---|
| Discovery (heatmaps) | get_system_heatmap, get_module_heatmap, get_service_heatmap |
Don't know where to look yet; find a class/method and its metrics |
| Discovery (calls/methods) | list_recent_calls, find_calls_by_method, search_methods, search_methods_detailed |
Get call_ids or locate a method by keyword |
Inspect one trace (needs call_id) |
get_trace_overview, get_trace, get_trace_raw, get_trace_subtree |
Read a known trace: overview → full de-noised → raw → single subtree |
| Compare | compare_traces, compare_traces_over_time |
Before/after diff, or a chronological series |
| Reproduce | get_replay_command |
Rebuild a curl/PowerShell command to replay a request |
| Utility | resolve_call_ids |
Map call_ids to short Class.method names |
| Tests | create_test_group, list_test_groups, list_test_group_classes, list_test_group_methods, build_test_payload, delete_test_group, set_test_group_enabled, regenerate_test, get_test_results |
Manage and inspect record-and-replay test groups |
- Discover —
get_system_heatmaporlist_recent_callsto find a method or freshcall_id. - Inspect —
get_trace_overviewfor a quick tree;get_tracefor full de-noised payloads (default for deep analysis). - Compare —
compare_tracesfor before/after; openget_tracewhen the diff needs payload proof. - Reproduce —
get_replay_command, run it, wait ~45s, thenlist_recent_callsagain.
Tool names encode intent: discovery tools when you do not have a call_id yet; get_trace* when you do.
Several important behaviors are implemented inside server.py, not just delegated to the backend API.
get_trace_overviewbuilds a readable execution treeget_tracereturns the whole tree with full fidelity but without raw Jackson/type-wrapper noise (typically 50-65% smaller thanget_trace_raw, secrets redacted, child calls ordered chronologically)get_trace_rawandget_trace_subtreeare also redacted; use them only when you need the verbatim shape or a single method boundary- SQL, REST, queue calls, timings, return values, and errors are formatted for direct MCP output
compare_tracesdetects method-path drift- payload and contract changes are compared after normalizing Java-serialized structures
- volatile fields such as IDs, UUIDs, timestamps,
traceId, andcallIdcan be ignored for cleaner diffs - SQL execution deltas are grouped and normalized to surface likely N+1 patterns
- captured request URLs are normalized so internal Docker hostnames can be replayed from the host shell
curland PowerShell commands are generated from recorded headers, method, URL, and body
- the server can rebuild replacement payloads through MCP-accessible APIs when direct helper data is not available
- test-group inspection is formatted for quick agent use instead of raw response browsing
| Layer | Responsibility |
|---|---|
| BitDive backend | Stores traces, monitoring data, and test metadata |
mcp-server |
Exposes MCP tools and adds comparison, normalization, and formatting logic |
| MCP client | Cursor, Claude Desktop, or another runtime invoking the tools |
- Python 3.11+
httpxmcp- a valid BitDive MCP token
Install dependencies:
pip install -r requirements.txt| Variable | Purpose | Default |
|---|---|---|
BITDIVE_MCP_TOKEN |
Default token when a tool call does not pass mcp_token |
none |
BITDIVE_API_URL |
Base BitDive Monitoring API URL | https://cloud.bitdive.io/monitoring-api |
BITDIVE_SKIP_VERIFY |
Disable TLS certificate verification when set to true |
false |
MCP_TRANSPORT |
MCP transport mode | stdio |
MCP_HOST |
Host for HTTP mode | 0.0.0.0 |
MCP_PORT |
Port for HTTP mode | 8000 |
Every tool also accepts an optional mcp_token parameter. If omitted, the server falls back to BITDIVE_MCP_TOKEN.
python server.pyMCP_TRANSPORT=streamable-http MCP_HOST=0.0.0.0 MCP_PORT=8000 python server.py{
"mcpServers": {
"bitdive": {
"command": "python",
"args": [
"/absolute/path/to/server.py"
],
"env": {
"BITDIVE_MCP_TOKEN": "your-token"
}
}
}
}| Path | Purpose |
|---|---|
server.py |
MCP server implementation |
requirements.txt |
Python dependencies |
- The server fails fast if no MCP token is available.
- Fresh traces may not appear in the hot cache immediately after replay; the built-in workflow expects a short wait before checking recent calls again.
- This repository is the MCP bridge and trace-intelligence layer. It does not capture JVM events itself and it does not execute JUnit replay tests by itself.