Knee-point detection in Python

A Python library for detecting knee (elbow) points in curves using the Kneedle algorithm. Given a set of x and y values, kneed returns the point of maximum curvature.
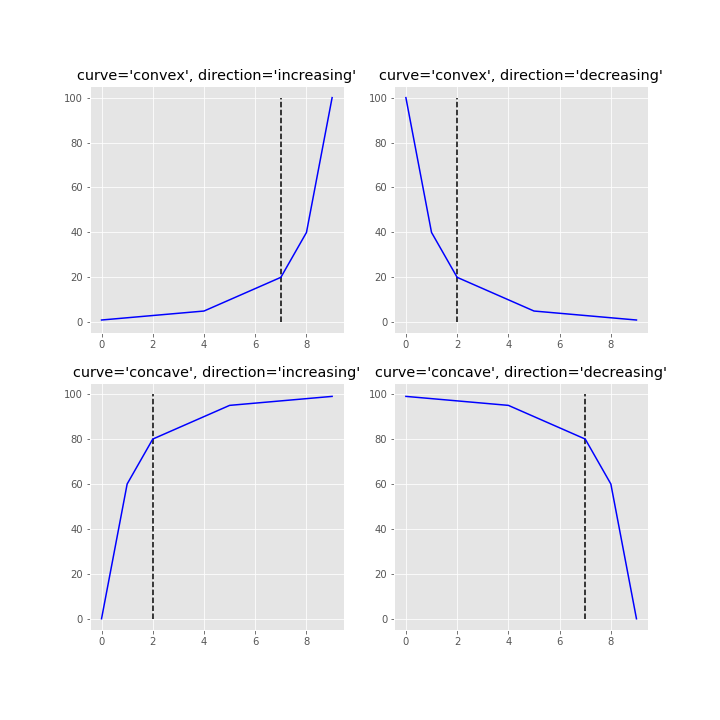
- Detect knee/elbow points in concave or convex curves
- Support for increasing and decreasing functions
- Automatic curve shape detection with
find_shape() - Multiple knee detection via online mode (
all_knees/all_elbows) - Tunable sensitivity parameter (
S) - Multiple interpolation methods (
interp1d,polynomial) - Built-in plotting for quick visualizations
kneed has been tested with Python 3.8, 3.9, 3.10, 3.11, and 3.12.
conda install -c conda-forge kneedpip install kneed # knee-detection only
pip install kneed[plot] # also install matplotlib for visualizationsgit clone https://github.com/arvkevi/kneed.git && cd kneed
pip install -e .from kneed import KneeLocator, DataGenerator
# Generate sample data
x, y = DataGenerator.figure2()
# Find the knee point
kl = KneeLocator(x, y, curve="concave", direction="increasing")
print(kl.knee) # 0.222
print(kl.knee_y) # 1.897If you're unsure about the curve type and direction, use find_shape() to auto-detect:
from kneed import find_shape

direction, curve = find_shape(x, y)
kl = KneeLocator(x, y, curve=curve, direction=direction)These steps reproduce Figure 2 from the original Kneedle manuscript.
The DataGenerator class is a utility to generate sample datasets.
Note:
xandymust be equal length arrays.
from kneed import DataGenerator, KneeLocator

x, y = DataGenerator.figure2()

print([round(i, 3) for i in x])
print([round(i, 3) for i in y])

[0.0, 0.111, 0.222, 0.333, 0.444, 0.556, 0.667, 0.778, 0.889, 1.0]
[-5.0, 0.263, 1.897, 2.692, 3.163, 3.475, 3.696, 3.861, 3.989, 4.091]The knee (or elbow) point is calculated by instantiating the KneeLocator class with x, y and the appropriate curve and direction.
Here, kneedle.knee and kneedle.elbow store the point of maximum curvature.
kneedle = KneeLocator(x, y, S=1.0, curve="concave", direction="increasing")

print(round(kneedle.knee, 3))
0.222

print(round(kneedle.elbow, 3))
0.222
The knee point returned is a value along the x axis. The y value at the knee can be identified:
print(round(kneedle.knee_y, 3))
1.897The KneeLocator class has two plotting functions for quick visualizations.
Note that all (x, y) are transformed for the normalized plots
# Normalized data, normalized knee, and normalized distance curve.
kneedle.plot_knee_normalized()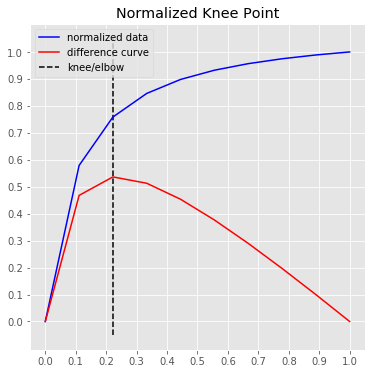
# Raw data and knee.
kneedle.plot_knee()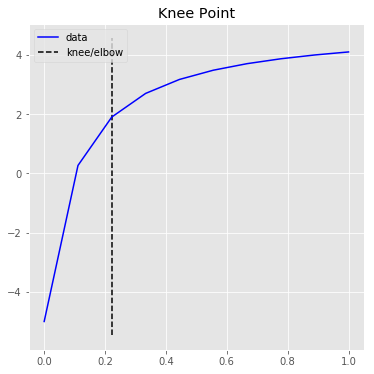
Full documentation including parameter tuning guides, real-world examples, and API reference is available at kneed.readthedocs.io.
An interactive Streamlit app is available to explore the effect of tuning parameters:
share.streamlit.io/arvkevi/ikneed
You can also run your own version — head over to the source code for ikneed.
Contributions are welcome, please refer to CONTRIBUTING to learn more about how to contribute.
If you use kneed in your research, please cite:
Satopa, V., Albrecht, J., Irwin, D., and Raghavan, B. (2011). "Finding a 'Kneedle' in a Haystack: Detecting Knee Points in System Behavior." 31st International Conference on Distributed Computing Systems Workshops, pp. 166-171.
@inproceedings{satopa2011kneedle,
  title={Finding a "Kneedle" in a Haystack: Detecting Knee Points in System Behavior},
  author={Satopa, Ville and Albrecht, Jeannie and Irwin, David and Raghavan, Barath},
  booktitle={31st International Conference on Distributed Computing Systems Workshops},
  pages={166--171},
  year={2011},
}