Use flight features to predict flight delay using logistic regression, decision tree and random forest.
This project aimed to improve the recall and precision score in predicting whether flights would have departure delays from previous work. We experimented with different combinations of classifier models and preprocessing procedures to resolve the problems we identified in previous work, such as label imbalance and encoding of categorical features. With resampling of the training data and use of a random forest classifier, we achieved higher recall, precision, and f2 scores, and thus a more robust and useful flight delay predictor.

Flight delays almost constantly occur. It’s not only annoying as it may disrupt people’s travel plans, but also it has led to enormous amounts of costs for the airlines, passengers, and other indirect sources. In 2019 in the US, the total estimated cost of delay was as high as 33 billion dollars [1]. To address such problems, this project aimed to develop a robust flight delay prediction model that could help airports, airlines, and passengers to adjust their schedule and potentially reduce the cost for flight delay.
Compared to previous work that attempted to predict flight delay based on weather data [2], we hope to extract the patterns only from regular features such as estimated departure time or the origin and destination airport. We reasoned that the fluctuating nature of weather information makes it less instructive for airports or airlines to optimize the coordination of flights, for which regular features may be helpful. Thus, we targeted the “Reporting Carrier On-Time Performance (1987-present)” [3] and experimented to predict whether a flight had a departure delay for over 15 minutes. Previous work on Kaggle that studied earlier data from the same source achieved an accuracy of 0.81 with Naive Bayes Classifier [4]. However, other metrics such as recall, precision, and f2 weren’t ideal (0.46, 0.12, and 0.29 respectively). Because the classes (i.e., delay for over 15 minutes or not) are naturally imbalanced, these metrics might suggest that the accuracy might overestimate their model’s effectiveness. This project also only worked with data from 2009 to 2018, before the COVID-19 pandemic and resulting quarantine, which might result in a different delay pattern today. Therefore, this project aimed to predict flight delay with the most recent data and improve the recall and precision compared to previous work. Varied combinations of preprocessing approaches and models were experimented with. Finally, we tuned and trained our optimal pipeline that involved m-estimate encoding, resampling, and a random forest classifier, and achieved both higher recall and precision score as planned, the contributions to which will be discussed in later sections.
-
M-estimate Encoding (category_encoders.m_estimate.MEstimateEncoder): M-estimate encoding is a preprocessing method for categorical variables that encodes the posterior probability of the target given a categorical value (zEquation 1). N is the total sample count of a particular category while n is the count of samples with target = 1 and this category. pa is the prior probability. m is the additive smoothing factor for reducing overfitting. It was used in this project to handle categorical variables with too many classes (i.e., > 400).
-
Logistic Regression (sklearn.linear_model.LogisticRegression): Logistic regression is a model that predicts the probability of a certain binary class. Specifically, it uses a logistic function (Equation 2) with input of a linear combination of independent variables to estimate the probabilities. It was used in this project as it is a basic attempt for predicting a binary target variable.
-
Decision Tree Classifier (sklearn.tree.DecisionTreeClassifier): Decision tree is a tree-like algorithm that can be used for binary classification for this project. Each node is a condition on one of the independent variables that leads to a prediction of target (or the probability of each class of target).
-
Random Forest Classifier (sklearn.ensemble.RandomForestClassifier) Random forest is an ensemble method that predicts the target class based on averaging the predictions of multiple decision trees, which is usually more powerful than a single decision tree as this bootstrapping procedure will reduce the variance of the overall model while maintaining low bias. It was used in this project as a comparison to the more basic decision tree classifier.
-
Categorical Naive Bayes Classifier (sklearn.naive_bayes.CategoricalNB) Naive Bayes is a statistical model based on Bayes’ theorem and the assumption that the condition features are all independent to each other. Classes are predicted with Equation 3. Specifically, Categorical naive bayes estimates the likelihood P(xi|y)with the same equation used in m-estimate encoding (Equation 1). It was used in this project for its more direct use of posterior probabilities for prediction in contrast to m-estimate, which is a preprocessing step before a selected model was applied on the data.

We downloaded the whole-country data for the latest 3 available months, from May. 2021 to Jul. 2021, from “Reporting Carrier On-Time Performance (1987-present)” [3]. The three-month range was chosen for speculation that the COVID-19 pandemic might disturb the regular flight delay pattern, so we chose the months when the gradually fulfilled vaccination presumably started to stabilize the data. The dataset consists of approximately 1.5 million rows of flights and 27 columns of features, including basic information about each flight and its delay status. Table 2 showed the remaining features after feature selection and before further preprocessing, both of which would be discussed in the following sections.
We chose a binary feature, DepDel15, as the target. That is, whether a flight has a departure delay for over 15 minutes, with 1 indicating true and 0 indicating false. The ratio of label(1):label(0) was 341250:1258095, approximately 1:4. We dropped features based on the following three criteria:
- Ungeneralizable and “cheating” features: We dropped year and month since we only used three months’ data. Also, we dropped some features that won’t be helpful for flight delay prediction in reality, such as the taxi-out time, i.e. the time between departure and the wheels of the plane being off the ground.
- Features with high correlation with other features: We used Pearson correlation matrix to investigate correlation between the numerical features (Figure 1). To prevent collinearity, we dropped the estimated arrival time and the estimated elapsed time for their high correlation with the estimated departure time and the estimated distance respectively (r = 0.71, r = 0.99).
- Features with very low correlation with the target: For day of month and day of week, which had correlations of as low as r = 0.021 and 0.0044 with the target. We decided to convert them to categorical variables for further preprocessing.
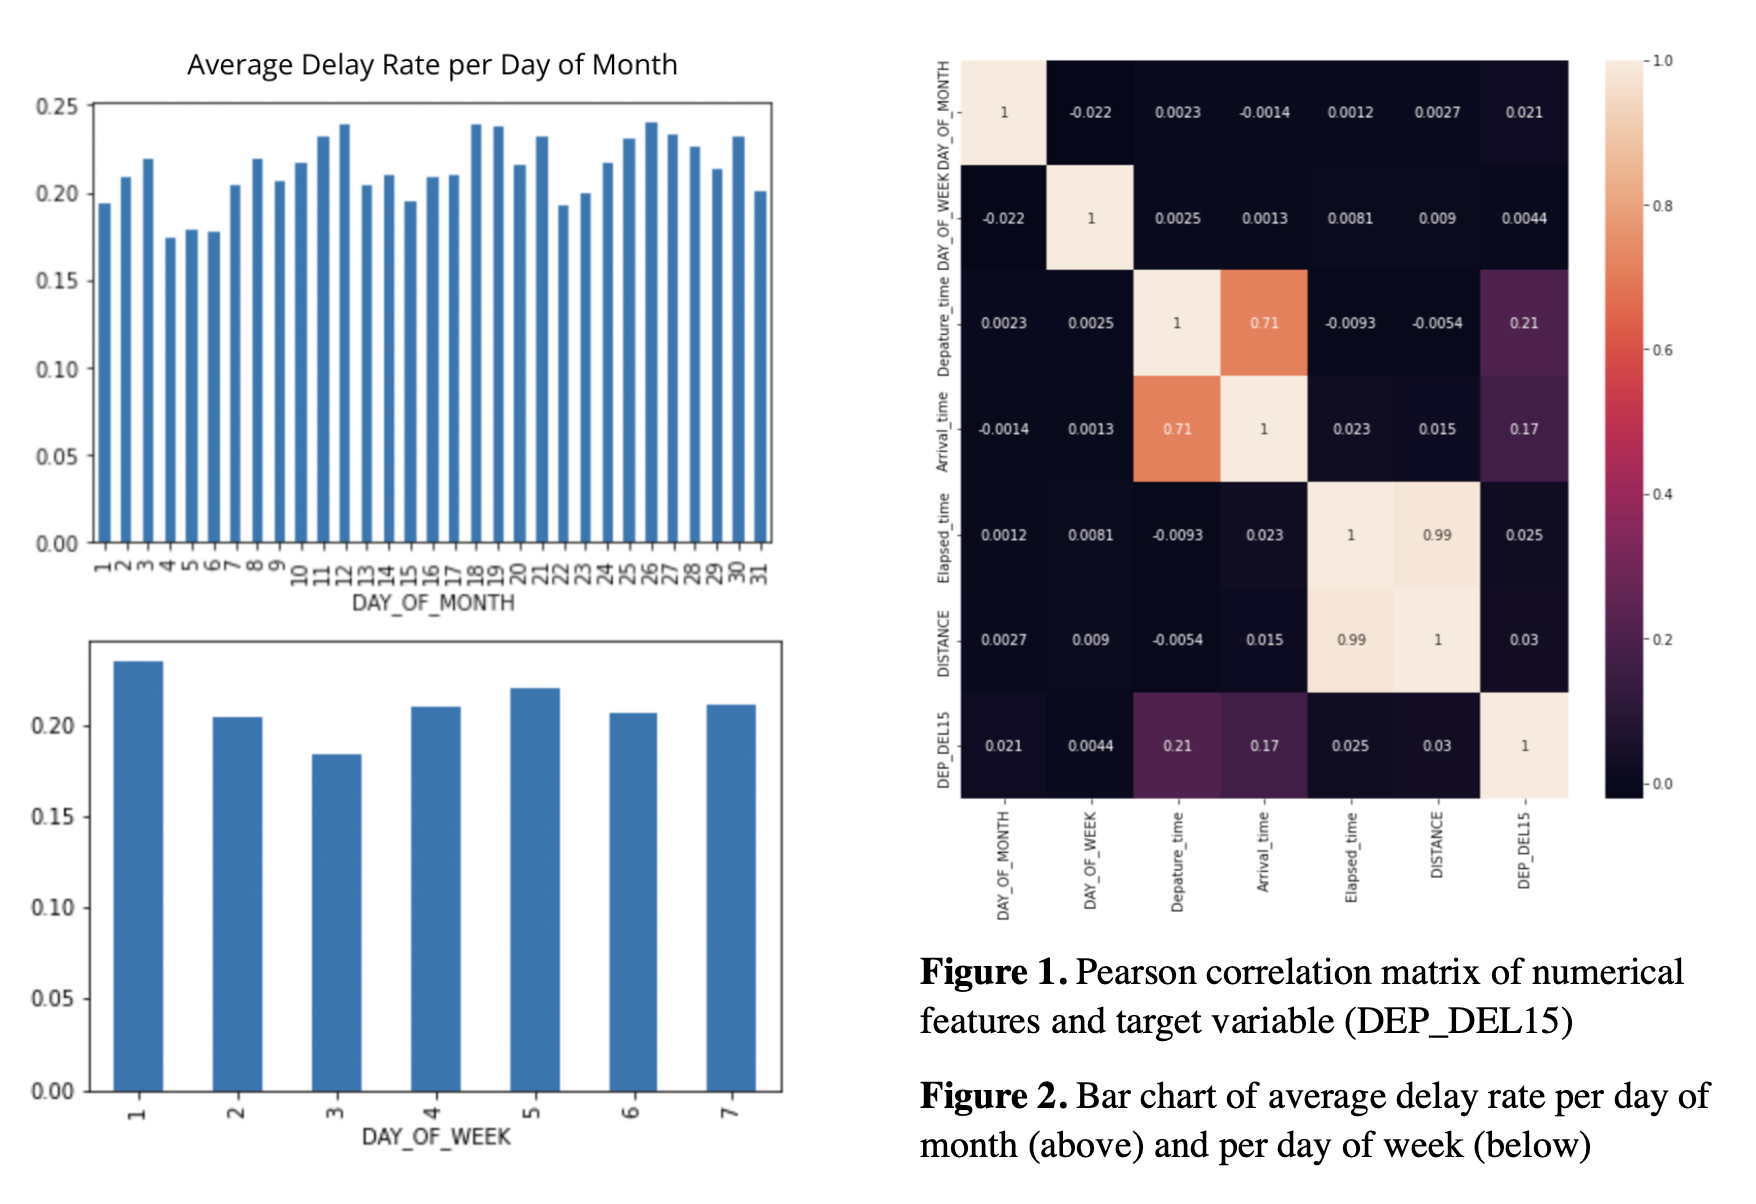
We used exploratory data analysis to see the distribution of categorical features. Figure 2 demonstrated the distribution of the average delay rate in each day of month and in each day of week. We observed variance across different days of month that might be informative in the model. Thus, we kept them as the categorical variables. We also plotted a bar chart of the frequency of top 20 origin airports of flights and pie charts of flight carriers and origin states (Figure 3). Atlanta was the busiest airport, followed by Dallas and Denver. Delta and Southwest carried the most flights, followed by American Airlines and Skywest. Texas, California and Florida had the largest number of flights.

The categorical features in our dataset had many classes. We initially attempted to one-hot encode all these features, but ended up creating 1600 new features. Given our sample size, this amount of features caused RAM shortage issues that disabled us from modeling. To handle these features, we first dropped the departure and arrival city because the distributions of their classes were quite similar to those of the departure and arrival airports. We then devised three approaches for comparisons:
- We dropped arrival and departure airports. Then, sklearn.preprocessing.OneHotEncoder would yield 123 features, which was feasible for modeling without RAM issues.
- We combinedly used count encoding (i.e., the sample count with a particular class) and m-estimate encoding and proceeded with modeling.
- We mapped both our numerical features into categorical ones, encoded them with sklearn.preprocessing.LabelEncoder, and used the categorical naive bayes classifier. Specifically, we mapped the distance into short, medium, and long (below 500, between 500 and 1000, and above 1000). We mapped the estimated departure time into four quarters of the day (i.e., before 6am, between 6am and 12pm, between 12pm and 6pm, and after 6pm).
Given the label ratio of 1:4, we reasoned that it might result in previous work’s low recall and precision despite a high accuracy of 0.81. To address this limitation, we experimented with upsampling. We first split the dataset into train and test sets with 2:1 ratio. Then, we resampled the training data with sklearn.utils.resample such that the ratio of label 1 and 0 became 1:1, 4:5, 2:3, or 1:2. We would show our non-exhaustive comparisons between their performances.
Because of the ML algorithm's sensitivity to the relative scales of features,” we scaled our features to make them of the same importance with sklearn.preprocessing.StandardScaler.
For our first two categorical feature handling approaches, we experimented with logistic regression, decision tree, and random forest. We acknowledged that 1) m-estimate encoding needed tuning of the smoothing factor m, 2) we wanted that in cross validation, the m-estimate encoder would only fit the out-of- fold data for transformation such that there was no validation data leakage, and 3) we needed standard scaling after the encoding. Therefore, we built pipelines with sklearn.pipeline. Pipeline to combine different preprocessing strategies and the models (Figure 4).

We tuned the hyperparameters in these pipelines with tune_sklearn.TuneSearchCV (Table 3). We adopted a random search within the selected range of hyperparameters and conducted 5-fold cross validations. Finally, we selected the pipeline with the highest CV f2 score, because we aimed to focus more on recall and precision that previous work might overlook. We decided to assign heavier weight to recall because we believed it was less acceptable to be told a flight is on time when it was not.

Table 4 showed the best CV metrics after we tuned each pipeline. We chose the optimal pipeline for our purpose with the combination of random forest, m-estimate encoding, and upsampling to 1:1 label ratio, where we achieved the highest CV f2 score (0.77) and a relatively good CV accuracy (0.78). The hyper- parameters to achieve it was m=88 for m-estimate encoding, and n_estimators=84, criterion=‘entropy’, max_samples=None, max_depth=None, min_samples_leaf=15, and warm_start=True for the random forest classifier. We scored the chosen model with the test data, and achieved f2 of 0.56, recall of 0.59, precision of 0.44, accuracy of 0.75, and the roc auc score of 0.76 (Table 5, Figure 5).

As mentioned, previous work on similar data only trained Naive Bayes classifiers for flight delay prediction and overlooked the potential problem of label imbalance [3], which thus produced a high accuracy with low precision and recall scores. We experiment with means to improve from this result with preprocessing methods such as different label-resampling ratios and encoding methods for categorical features, as well as multiple classifier models. We were able to improve the f2 score as desired with the tuned pipeline that included m-estimate and count encoding, upsampling training data to 1:1 label ratio, and random forest classifier. This pipeline yielded a test f2 score of 0.56 and accuracy of 0.75. Despite slightly lower accuracy compared to previous work, we considered that the much higher f2 score, both precision and recall scores specifically, indicated a more insightful predictor than the previous ones. Because it handled both false positive and false negative rates better.

Our experiments enabled us to compare the performances of combining different preprocessing methods and classifiers. As predicted, we found that random forest generally had higher accuracy and f2- score than logistic regression and decision tree, but took longer time for training and predicting. Due to the size of our dataset and the constraint in time, we weren't able to experiment with similar or more advanced models such as gradient boosting classifiers or neural networks, which future work could potentially experiment with. Additionally, we didn’t find much difference between the categorical feature encoding methods. We thus investigated the feature importance of our optimal random forest model (Figure 6). As a result, the estimated departure time had much higher importance (0.24) than the other features, which was a numerical feature that wasn’t affected by our manipulation. Among the categorical ones, the most important feature was the day of month (0.09). Hence, the relatively low importance of categorical features for our problem was the likely reason for no difference between different encoding methods. Its implication was quite surprising to us that none of the factors like departure or arrival airports, cities, or states, or the carriers matter as much as more general factors like estimated departure time or the date. We also observed that as the proportion of samples with label 1 increased, there was a trade-off pattern that the f2 score would increase while the accuracy would decrease. For our purpose, we sought for the models with higher f2 scores, but it may be of interest to seek other balance points in this trade-off for future work in this field but with different emphasis. Finally, we had several considerations for future improvement. Firstly, besides the target feature that we focused on in this project, we observed that some other independent features, such as the carriers, also had imbalance classes, which future studies may better handle. Secondly, although we intentionally selected data from May 2021, the flight status at that time point might still be affected by the COVID-19 pandemic, and thus had less regular pattern for generalizable prediction. Thus, more post-pandemic data can and should be used in the future. More efforts in these directions will further the progress in this project to improve the flight delay predictors in the future.
(https://drive.google.com/drive/folders/1lUGmQqyiSFFVjII-tNU4h19MMtxJ0afZ?usp=sharing)
Cost of Delay Estimates 2019 - Federal Aviation Administration. 8 July 2020, https://www.faa.gov/ data_research/aviation_data_statistics/media/cost_delay_estimates.pdf.
Etani, Noriko. “Development of a Predictive Model for on-Time Arrival Flight of Airliner by Discovering Correlation between Flight and Weather Data - Journal of Big Data.” * SpringerOpen, Springer International Publishing, 20 Sept. 2019, https://journalofbigdata.springeropen.com/articles/10.1186/ s40537-019-0251-y.
Bureau of Transportation Statistics. * Reporting Carrier On-Time Performance (1987-Present) * , Sept. 2021, https://www.transtats.bts.gov/Fields.asp?gnoyr_VQ=FGJ. Accessed 2021.
Egilmez, Gokhan. “Classifying a Flight with Naive Bayes Classifier.” * Kaggle, Kaggle, 2 Nov. 2020, https:// www.kaggle.com/gokhanegilmez/classifying-a-flight-with-naive-bayes-classifier.