Question-1-Synchronic word embedding
Question-2-Diachronic word embedding
Q1
-
Calculate cosine distance between each pair of word embeddings you have extracted, and report the Pearson correlation between word2vec-based and human similarities. [1 point]
- PearsonRResult(statistic=0.830817384168786, pvalue=5.943545020602274e-11))
-
Comment on this value in comparison to those from LSA and word-context vectors from analyses in the earlier exercise. [1 point]
-
The rounded-by-2 results from the previous exercise:
- Pearson Correlation between Human and M1: PearsonRResult(statistic=0.32, pvalue=0.01)
- Pearson Correlation between Human and M1Plus: PearsonRResult(statistic=0.19, pvalue=0.10)
- Pearson Correlation between Human and M2_10: PearsonRResult(statistic=0.19, pvalue=0.13)
- Pearson Correlation between Human and M2_100: PearsonRResult(statistic=0.37, pvalue=0.00)
- Pearson Correlation between Human and M2_300: PearsonRResult(statistic=0.36, pvalue=0.00)
-
The Pearson Correlation result between word2vec-based and human similarities is much closer to 1.0 than all the previous results (around 0.2 to 0.4) from LSA and word-context vectors, which suggests that word2vec embeddings reflect the similarity of word meanings better than LSA and word-context vectors from analyses in the earlier exercise, in the sense that word2vec results are much more positively correlated to human-deemed similarities.
-
-
Report the accuracy on the semantic analogy test and the syntactic analogy test [2 points]
- 0.7401448525607863
-
Repeat the analysis with LSA vectors (300 dimensions) from the earlier exercise, comment on the results in comparison to those from word2vec. [1 point]
- (rounded by 4) 0.0012 for semantic analogy test & 0.0028 for syntactic analogy test
- Comment:
- LSA analogy test accuracy results are remarkably lower than those derived from word2vec
- In terms of syntactic and semantic word modeling, word2vec performs much better than LSA in analogy tasks
-
Suggest a way to improve the existing set of vector-based models in capturing word similarities in general, and provide justifications for your suggestion. [2 points]
There are several ways to improve the existing vector-based models in capturing word similarities:
- Learn and capture deeper and multiple meanings of words will reduce the mistakes in calculating similarity. Bidirectional models such as ELMo, BERT and ERNIE would beat the above-mentioned models. Because they are trained to learn the word embeddings from more contexts through architectures such as bidirectional deep LSTM layers and transformers with multi-head attention layers. This encapsulates the word meanings better and hence can increase the accuracy in capturing word similarities. While the existing set of vector-based models like word2vec map 1 vector to 1 word, this sometimes mix up and collapse different semantics and syntaxes that English words often have, causing inaccuracy in the calculation of word similarities.
- So far the existing set of vector-based models have not considered word position, which is key to a better representation of both syntactic and semantic aspects. Incorporate word position in context (sentence, document, etc.) will improve the existing set of vector-based models in capturing word similarities in general.
- Another way of improving the exist set of vector-based models in capturing word similarities Measuring how common they are in different geographical places. For example, there exist different analogies in different english-speaking countries that aren't used elsewhere often.
- (Maybe we could consider developing/crafting a loss function when doing analogy test.)
Q2
- One way of tracking semantic changes is by counting raw word frequency (Hilpert & Gries, 2009)
- or counting the frequency of a word collocating with another word over time (Heyer, Holz, & Teresniak, 2009)
- changes in POS tags
- changes in vectors?
- Montariol (2021) describes two measures that can be used to track semantic change over time:
- Inceptive drift, which computes the change of a word compared to that word at time t=0
- Incremental drift, which computes the change of a word from one time slice to the next
- The cosine similarity can be calculated for a word at one time period to a predetermined list of words and the same word to the same list at the next time period to measure semantic change.
20_most_changes ['haven', 'goals', 'johnson', 'therapy', 'adams', 'wilson', 'princeton', 'martin', 'baltimore', 'wiley', 'berkeley', 'techniques', 'sector', 'ml', 'jones', 'harper', 'mcgraw', 'skills', 'computer', 'shri']
20_least_changes ['april', 'miles', 'november', 'september', 'january', 'december', 'february', 'university', 'vessels', 'trees', 'cent', 'solution', 'july', 'decrease', 'october', 'temperature', 'buildings', 'june', 'patients', 'blood']
20_most_changes ['jones', 'radio', 'implications', 'variables', 'jobs', 'procedures', 'wiley', 'therapy', 'input', 'evaluation', 'programs', 'sector', 'objectives', 'goals', 'skills', 'shri', 'mcgraw', 'ml', 'computer', 'techniques']
20_least_changes ['april', 'november', 'december', 'january', 'september', 'trees', 'miles', 'solution', 'feet', 'june', 'february', 'vessels', 'century', 'duties', 'cent', 'blood', 'evening', 'buildings', 'decrease', 'july']
My Method 3: [Inceptive drift] The Cosine Distance change between the word at the start time and at the end time
20_most_changes ['film', 'shift', 'berkeley', 'patterns', 'perspective', 'impact', 'media', 'shri', 'van', 'approach', 'goals', 'sector', 'radio', 'computer', 'objectives', 'programs', 'techniques', 'ml', 'skills', 'mcgraw']
20_least_changes ['april', 'june', 'november', 'february', 'years', 'october', 'increase', 'january', 'century', 'months', 'daughter', 'december', 'god', 'september', 'feet', 'week', 'evening', 'door', 'payment', 'miles']
20_most_changes ['necessity', 'ratio', 'measures', 'credit', 'corner', 'attitude', 'reality', 'rates', 'plants', 'staff', 'pain', 'centre', 'oxford', 'parliament', 'aspects', 'russia', 'liberty', 'news', 'establishment', 'regards']
20_least_changes ['time', 'formula', 'rooms', 'film', 'equilibrium', 'colour', 'components', 'participation', 'ministers', 'blow', 'crowd', 'yield', 'berlin', 'baby', 'song', 'waste', 'sunday', 'quarters', 'leadership', 'pocket']
Evaluate the three methods following this proposed procedure and report Pearson correlations or relevant test statistics. [2 points]
My evaluation method is to find the 10 most similar words to a certain word and calculate their distances as follows.
most_similar = {}
K = 10

for i in range(len(w)):
    most_similar[w[i]] = [[] for l in range(10)]
    for j in range(10):
        sims = []
        matrix = np.array(E)[:,j,:]
        indexes = np.linalg.norm((matrix - E[i][j]), axis=1).argsort()
        sims = [w[a] for a in indexes[:K] if w[a] != w[i]]
        most_similar[w[i]][j].extend(sims[:K])

distances_5 = [] #
for i in range(len(w)):
    d = ( K - len( [a for a in most_similar[w[i]][0] if a in most_similar[w[i]][9]] ) ) / K
distances_5.append(d)array([[1. , 0.84506762, 0.6932991 , 0.21989351],
[0.84506762, 1. , 0.68926445, 0.23627123],
[0.6932991 , 0.68926445, 1. , 0.43578751],
[0.21989351, 0.23627123, 0.43578751, 1. ]])
The fourth row/column stands for distance_5 above, while the first three rows and columns are the Pearson correlations between the three methods proposed as above.
To evaluate the accuracy of the three methods, I used the Pearson correlation between my methods and distance_5, mentioned as the fourth column in the Pearson correlation array above.
The larger the distance_5 corresponding value for a certain word is, the more semantic changes it has experienced since it drifted away from most of its similar word from the first decade to the last decade.
Evaluate: the more correlated the distances_i (i = 1, 2, 3) is with distances_5 (the distances between the word and its most similar word), the more the method captures the semantic changes in the word over time.
Implement a simple way of detecting the point(s) of semantic change in each word based on its diachronic embedding time course—visualize the time course and the detected change point(s). [3 points]
The simple way of detecting the point(s) of semantic change in each word based on its diachronic embedding time course with visualization:
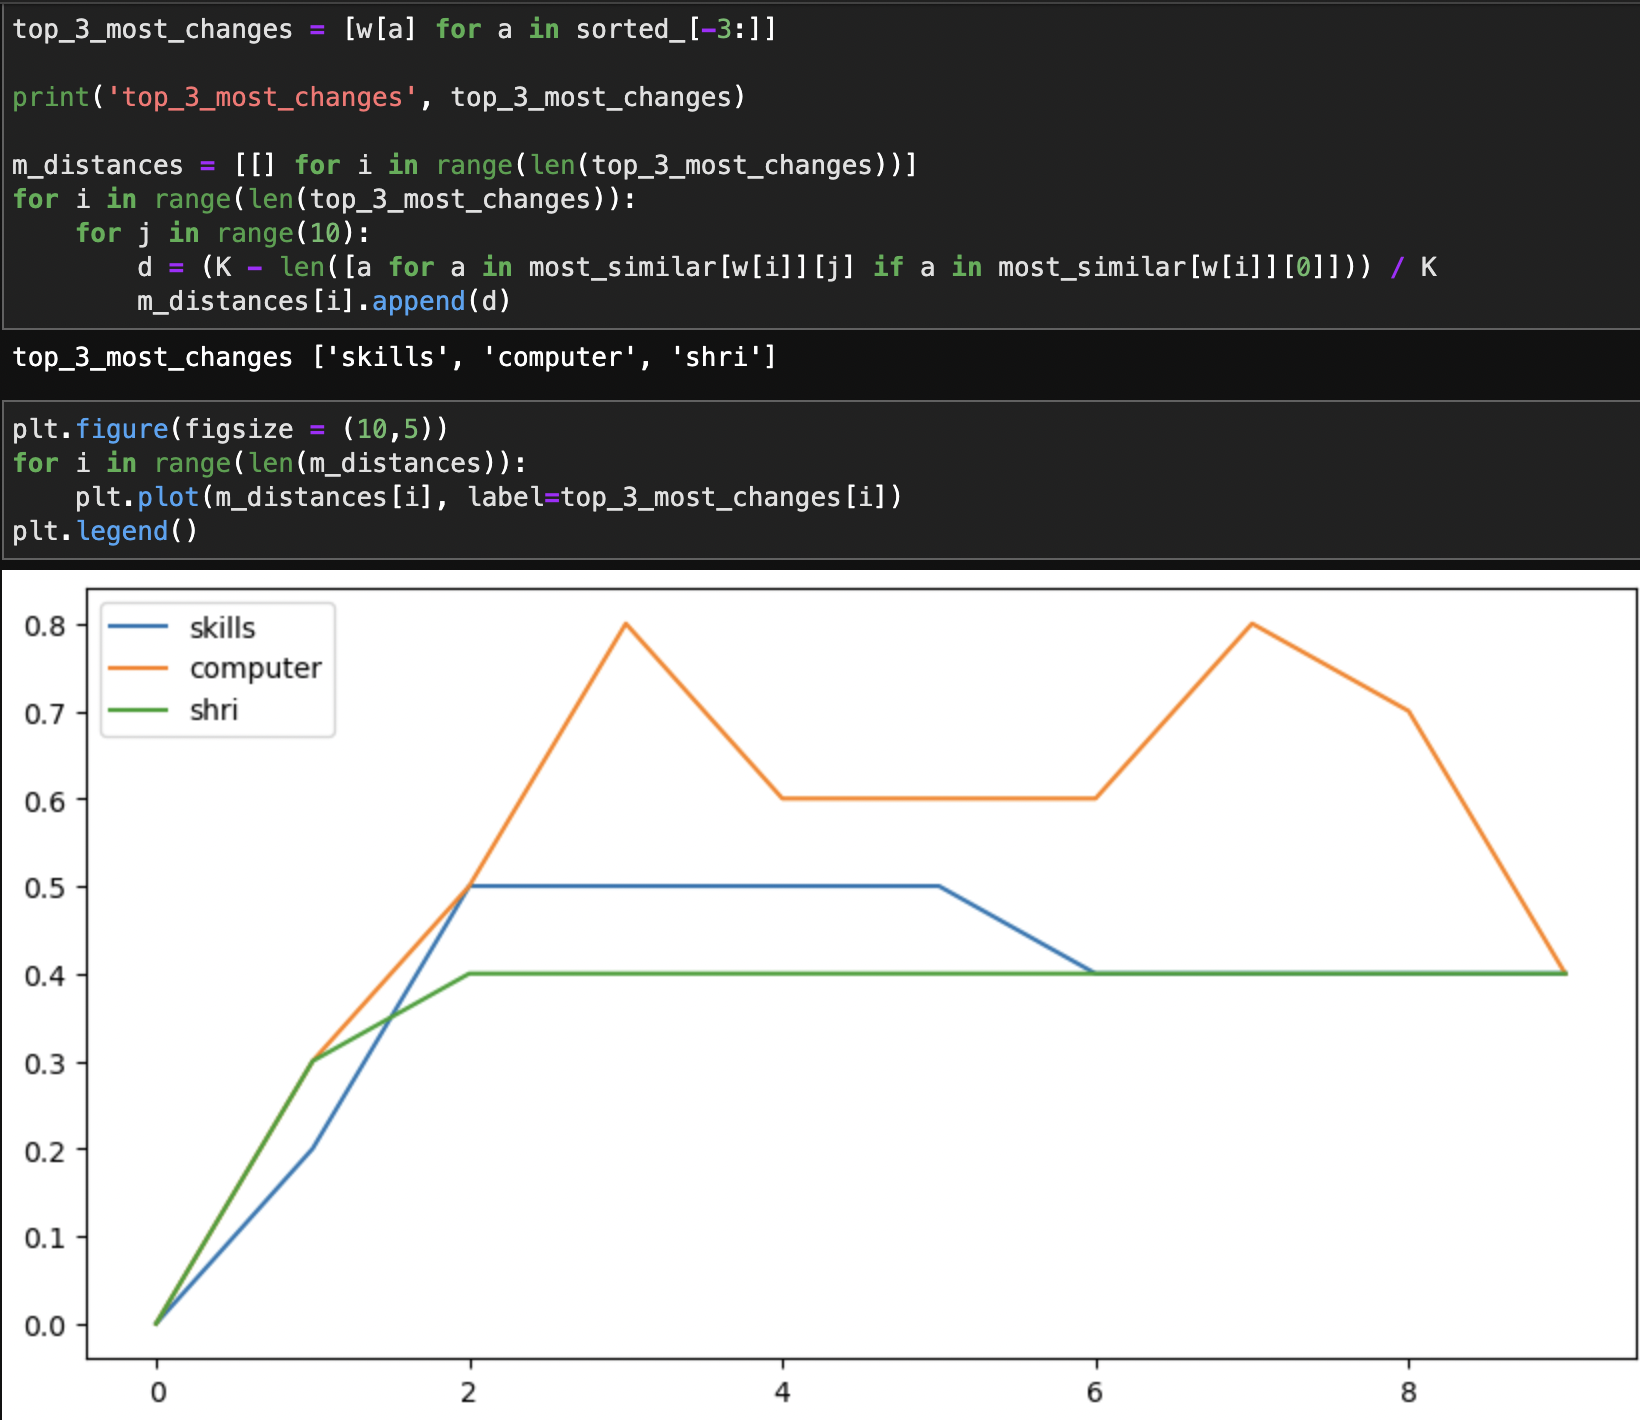
The xticks stands for the number of decade, for example, "0" means the first decade, "8" means the ninth decade.