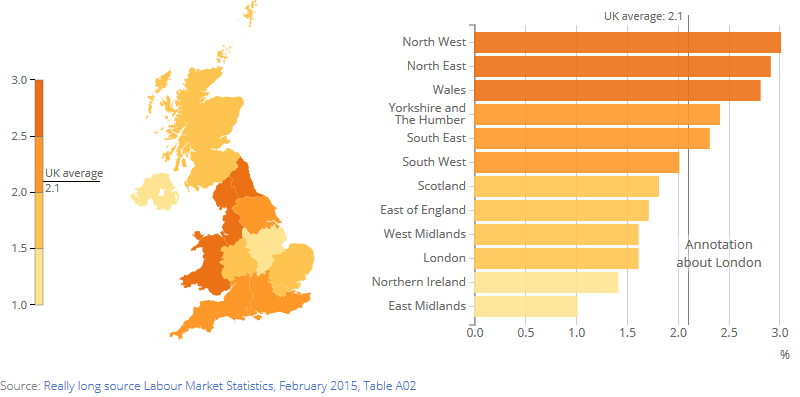
Regional bar map
The files for each chart should be of the following format:

The config file contains all the variables which you can adjust. Data.csv contains the data for your graph. The lib folder contains javascript libraries used. You'll also need the images folder.
If you’re making several charts they can share the same “lib” file as follows


Save your data in csv form of the following format:
| AREANM | AREACD | value | | ------------- | ------------- | ------------- | ------------- | | North East |E12000001 |2.9| |North West |E12000002 |3| |Yorkshire and The Humber |E12000003 |2.4| |East Midlands |E12000004 |1| |West Midlands |E12000005 |1.6| |East of England |E12000006 |1.7| |London |E12000007 |1.6| |South East |E12000008 |2.3| |South West |E12000009 |2| |Wales |W92000004 |2.8| |Scotland |S92000003 |1.8| |Northern Ireland |N92000002 |1.4|
Open the “config.json” file. You can open this in a text editor such as Notepad++ or TextEdit or download a code editor such as Atom, Dreamweaver, Brackets or Sublime Text 2.
These contain the main variables which the chart will need and will possibly need changing for each new chart.
"colour_palette":["#fee391","#fec44f","#fe9929","#ec7014"],
specifies the range of colours for the map and the bar chart. The number of colour must match the number specified in number_breaks (see below).
"sourceText":["Really long source Labour Market Statistics, February 2015, Table A02"],
"sourceURL":["http://www.ons.gov.uk/ons/publications/re-reference-tables.html?edition=tcm%3A77-350752"],
specifies the text and link of the source.
The bar chart can be annotated by changing the following
"annotationChart": ["Annotation  about London"],
"annotationBullet": ["Annotation  about London"],
"annotationXY":[["2.4","London"]],
"annotationAlign":["middle"],
annotationChart specifies the text to show on the bar chart. annotationBullet shows what text to show as a bullet point under the graph in the small view.annotationXY takes an array of arrays that give the x and y position of the annotation.annotationAlign modifies the text anchor of the annotation.
"barHeight_sm_md_lg" : [30,30,30], set the height of the bar graph in the three different view sizes
"xAxisLabel":"%", specifies the label of the x axis.
"xAxisScale":"auto_zero_max" set the scaling of the bar chart. Other options are "auto_min_max" or an specifies range for the x axis as an array e.g. [0,40]
"display_average": "yes", draws a line on the scale and bar chart for the average value which is specified in "average": 2.1,. If you don't want the average leave blank.
average_label sets the text to display on the key for the average.
"margin_sm": [25, 20, 35, 115],
"margin_md": [25, 20, 35, 115],
"margin_lg": [25, 20, 35, 115],
sets the margin for the charts in the three sized views.
"aspectRatio_sm" : [4,7],
"aspectRatio_md" : [1,1],
"aspectRatio_lg" : [16,10],
sets the aspect ratio for the charts in the three different view sizes.
"number_breaks" : 4, specifies the number of bins for the legend and colour scale.
"breaks_choice" : [1, 1.5, 2, 2.5, 3], specifies where the breaks for the bins should happen. Use "jenks" if you'd like to use the jenks algorithm and have breaks generated automatically.
"mobileBreakpoint" : 550, specifies the width for the smallest view
"x_num_ticks_sm_md_lg" : [6,8,10], specifies the number of ticks for the bar chart on the x axis. This is a preference and can be overridden by D3.
A line can be draw across all the bars by setting "centre_line" to be true and specifying where it should be drawn with "centre_line_value"