This Project tends to make prediction on student course dropout by building up three different models and then comparing them. They are CART, Conditional Inference Trees and C5 classification algorithms. Since many universities have a problem with students over-enrolling in courses at the beginning of semester and then dropping most of them as the make decisions about which classes to attend. This makes it difficult to plan for the semester and allocate resources. However, schools don't want to restrict the choice of their students. One solution is to create predictions of which students are likley to drop out of which courses and use these predictions to inform semester planning.
The data comes from a university registrar's office. The code book for the variables are available in the file code-book.txt. Examine the variables and their definitions.
First we visualize the relationships between our chosen variables as a scatterplot matrix.
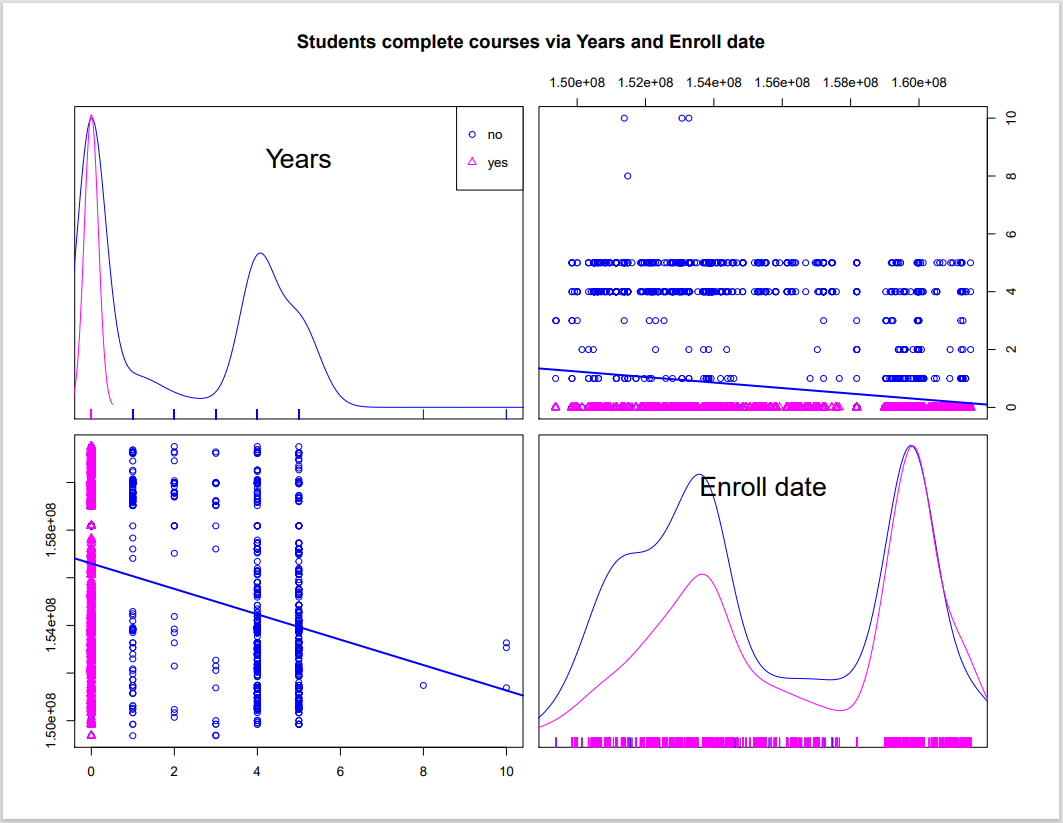
Based on the graph, it seems like the older the students are, the more they will drop the course. Since the courses are harder with grade growing, students have difficulties to assign their limited time to lots of courses' works. On the other hand, the date of enrollment does not affect the complete level. As no matter when the students add the course, the university give them enough time to take a look at how the classes work at the beginning of the semester.
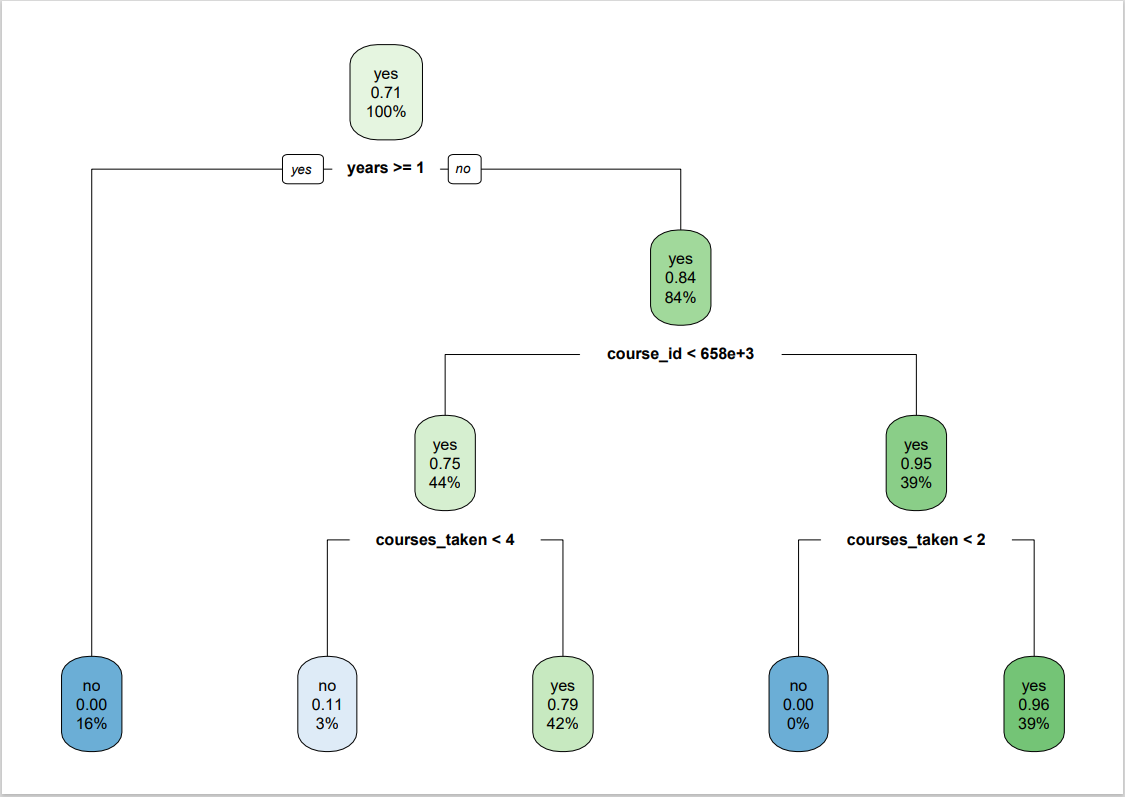
###CART The decision tree method is a powerful and popular predictive machine learning technique that is used for both classification and regression. So, it is also known as Classification and Regression Trees (CART).
The algorithm of decision tree models works by repeatedly partitioning the data into multiple sub-spaces, so that the outcomes in each final sub-space is as homogeneous as possible. This approach is technically called recursive partitioning.
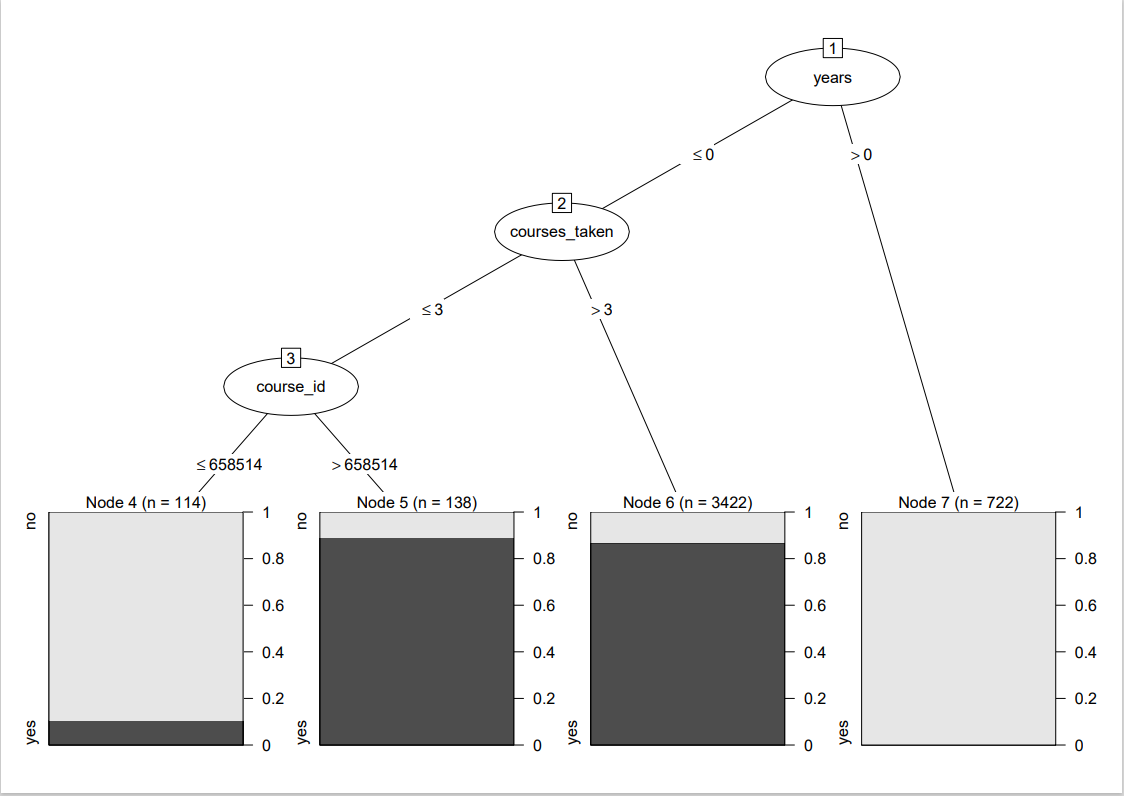
###Conditional Inference Trees Conditional Inference Trees is a different kind of decision tree that uses recursive partitioning of dependent variables based on the value of correlations. It avoids biasing just like other algorithms of classification and regression in machine learning. Thus, avoiding vulnerability to the errors making it more flexible for the problems in the data. Conditional inference trees use a significance test which is a permutation test that selects covariate to split and recurse the variable. The p-value is calculated in this test. The significance test is executed at each start of the algorithm. This algorithm is not good for data with missing values for learning.
The condFit image shows a brief decision tree on factors that influence whether the student will drop out a course or not.
###C5.0 This model extends the C4.5 classification algorithms described in Quinlan (1992). The details of the extensions are largely undocumented. The model can take the form of a full decision tree or a collection of rules (or boosted versions of either). When using the formula method, factors and other classes are preserved (i.e. dummy variables are not automatically created). This particular model handles non-numeric data of some types (such as character, factor and ordered data).
We see that the resampling will tell us the make statistical statements about the models' performance differences. In my opinion, the C5.0 model is the best fited model based on the summary statements.