For the plot examples, if I create a Figure instance with layout='constrained', then the cell plots will not in the right cell as follows:
fig, ax = plt.subplots(figsize=(6, 10), layout='constrained')

# All the other code is the same as the plot example
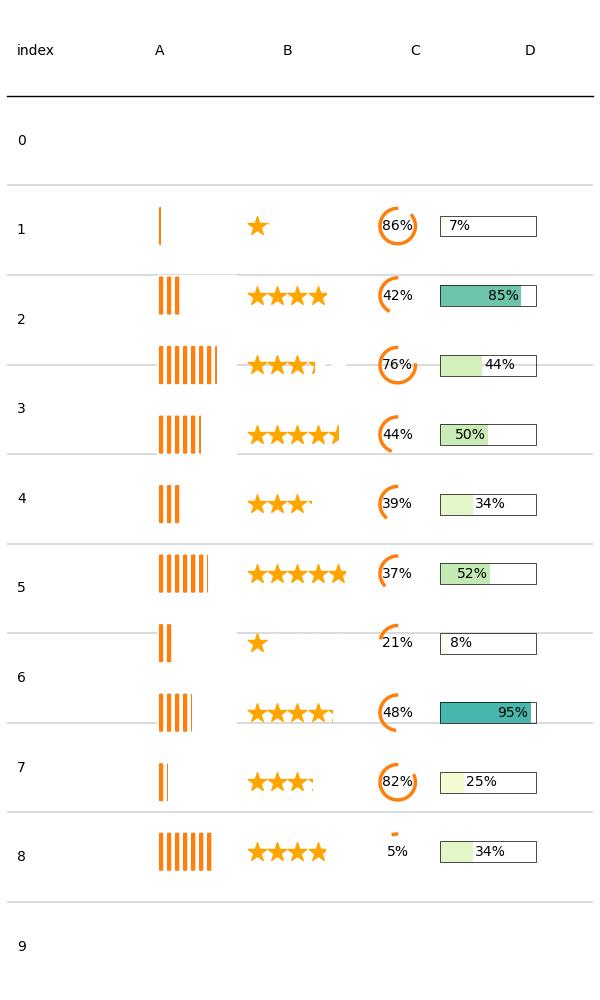
Hope this issue can be fixed.
For the plot examples, if I create a
Figureinstance withlayout='constrained', then the cell plots will not in the right cell as follows:Hope this issue can be fixed.