To save high quality plots, you can use the ggsave() function from the ggplot2 package to save your plot in high resolution. Here is an example code:
library(ggplot2)
# Create a plot
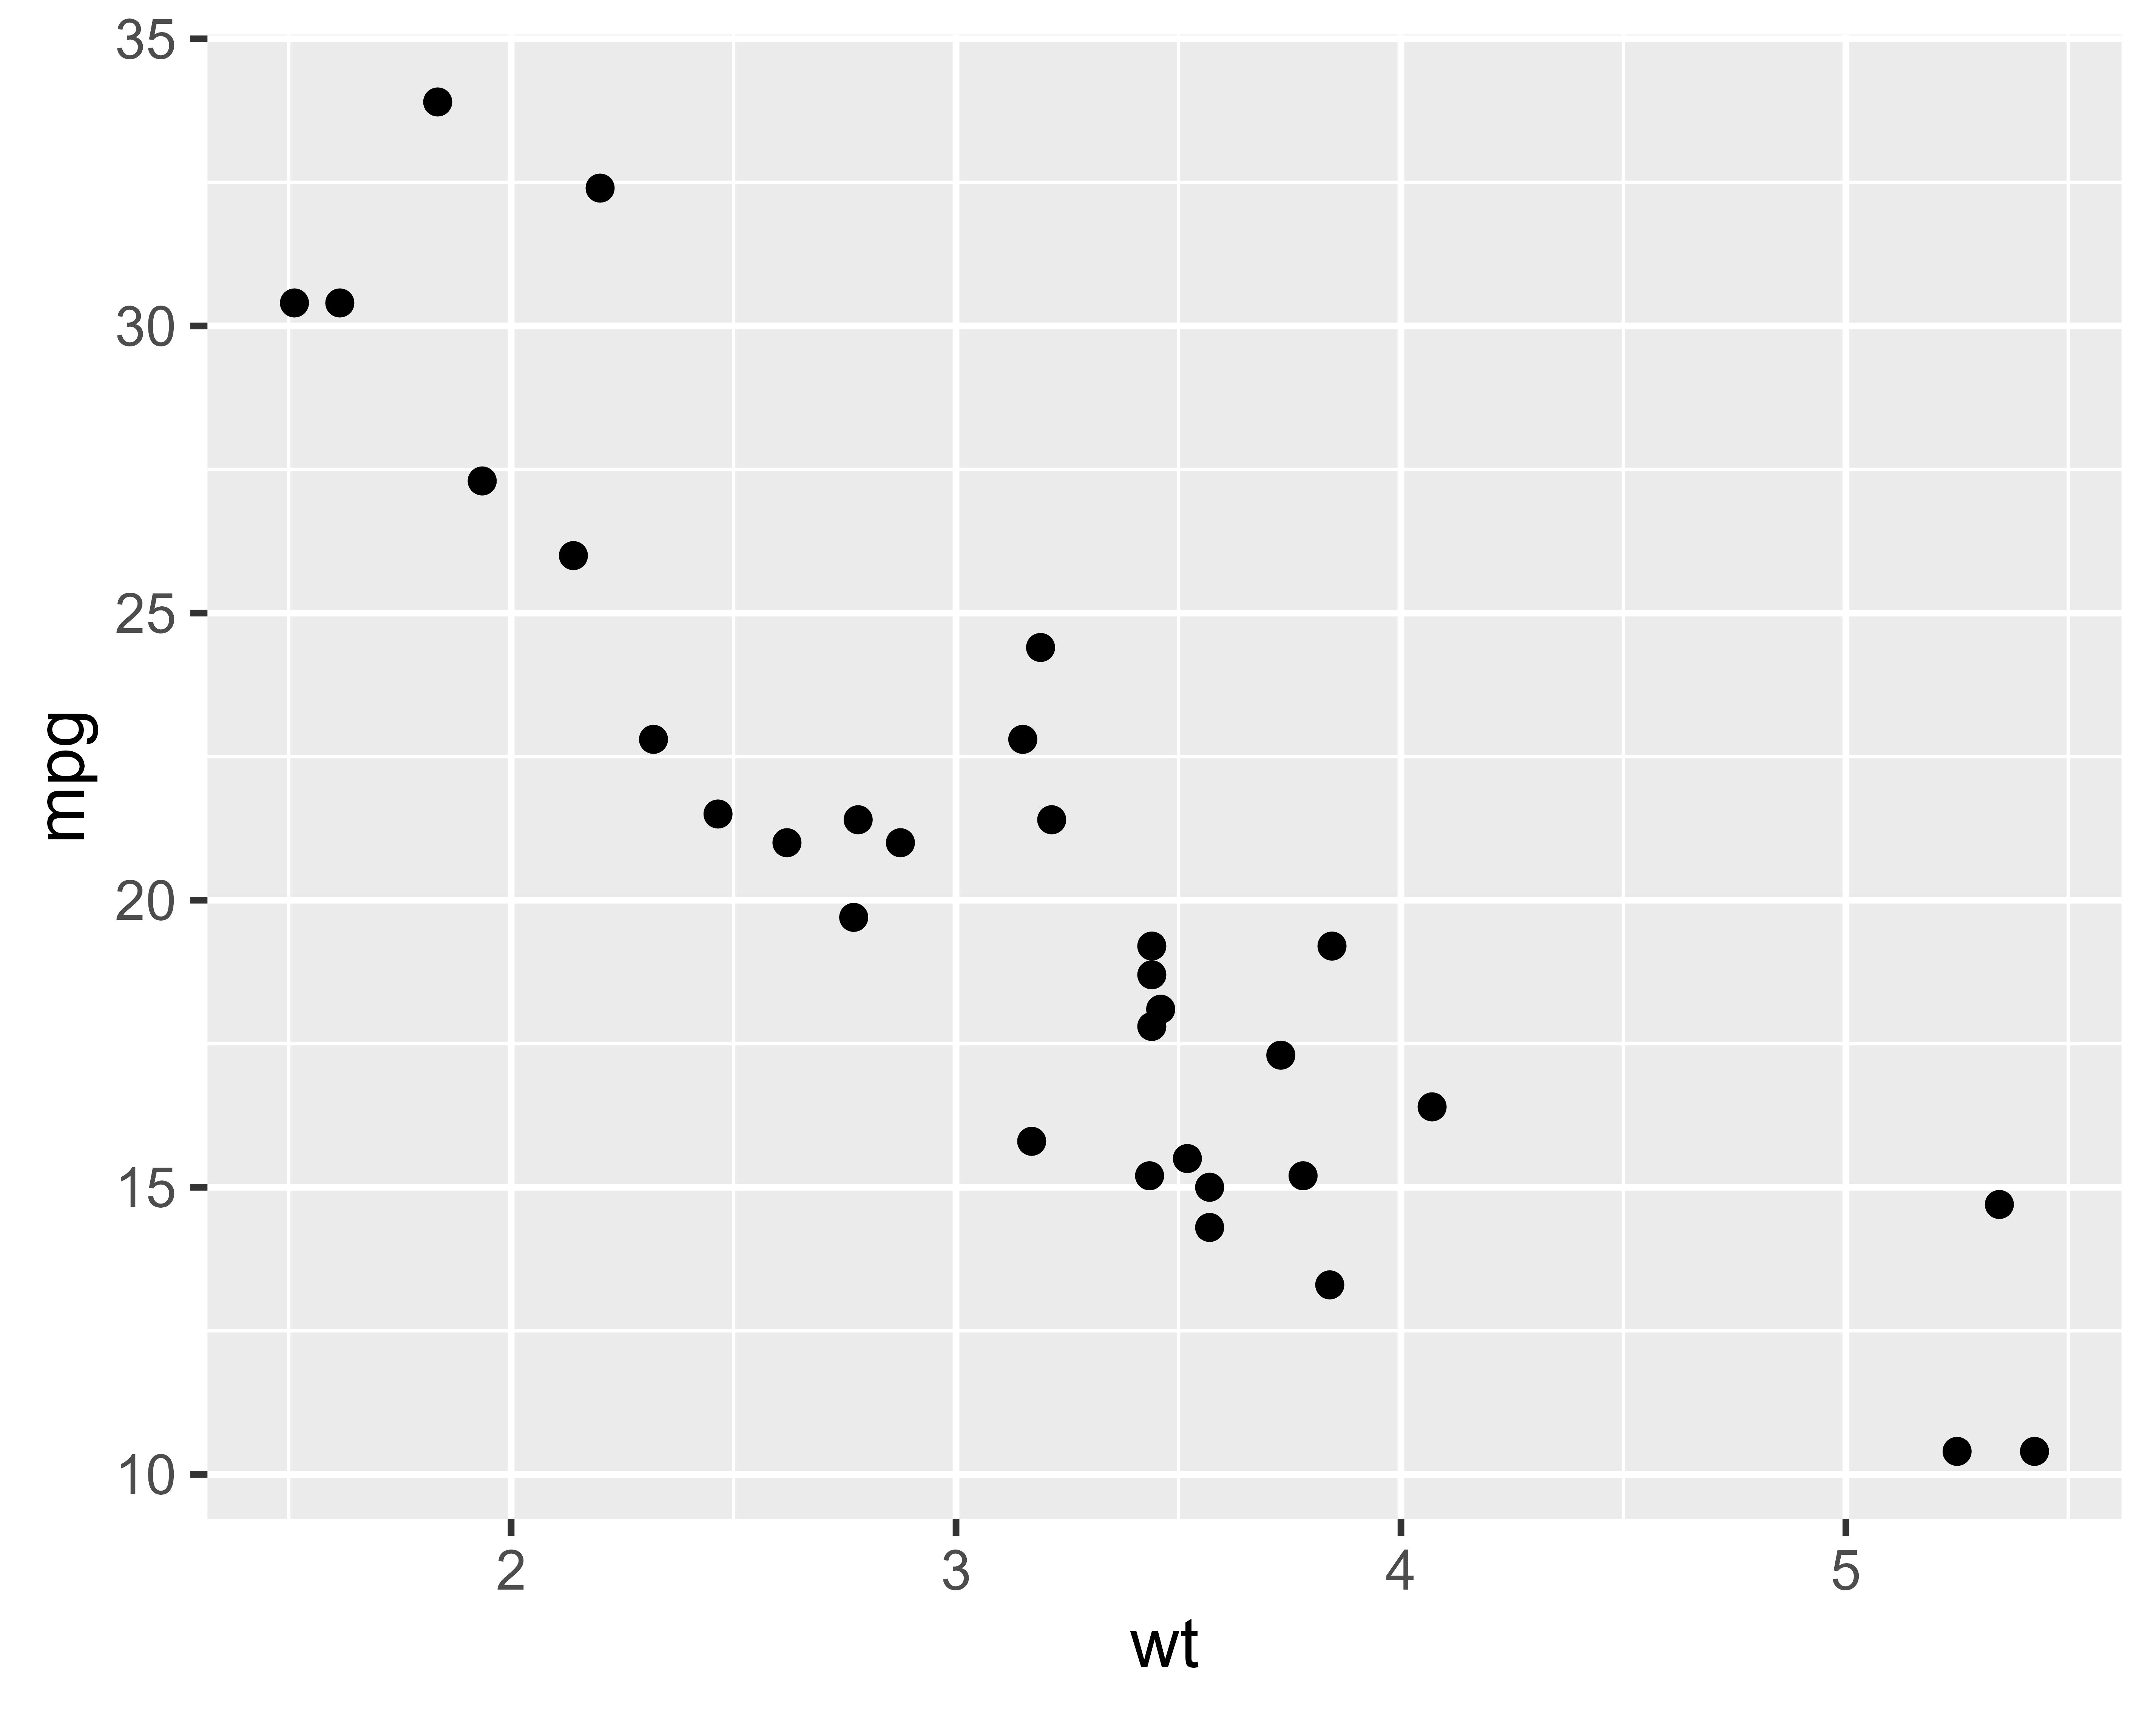
my_plot <- ggplot(mtcars, aes(x = wt, y = mpg)) +
geom_point()
# Save the plot in high resolution
ggsave("my_plot.png", plot = my_plot, dpi = 300)
Check your R home directory to see the saved high quality plot.
ggsave(
  filename,
  plot = last_plot(),
  device = NULL,
  path = NULL,
  scale = 1,
  width = NA,
  height = NA,
  units = c("in", "cm", "mm", "px"),
  dpi = 300,
  limitsize = TRUE,
  bg = NULL,
  ...
)
ggplot(mtcars, aes(mpg, wt)) +
  geom_point()

ggsave("mtcars.pdf")
ggsave("mtcars.png")

ggsave("mtcars.pdf", width = 4, height = 4)
ggsave("mtcars.pdf", width = 20, height = 20, units = "cm")

# delete files with base::unlink()
unlink("mtcars.pdf")
unlink("mtcars.png")
library(tidyverse)

data <- mpg

print(data)

write_csv(data, path="data.csv")
write_csv(
  x,
  file,
  na = "NA",
  append = FALSE,
  col_names = !append,
  quote = c("needed", "all", "none"),
  escape = c("double", "backslash", "none"),
  eol = "\n",
  num_threads = readr_threads(),
  progress = show_progress(),
  path = deprecated(),
  quote_escape = deprecated()
)
# If only a file name is specified, write_()* will write
# the file to the current working directory.
write_csv(mtcars, "mtcars.csv")
write_tsv(mtcars, "mtcars.tsv")

# If you add an extension to the file name, write_()* will
# automatically compress the output.
write_tsv(mtcars, "mtcars.tsv.gz")
write_tsv(mtcars, "mtcars.tsv.bz2")
write_tsv(mtcars, "mtcars.tsv.xz")