Cartographers and publishers have been creating maps for centuries, and their works often share distinct styles that reflect the trends and technologies of their times. One observation is that historical maps created by the same cartographer or publisher tend to have similar styles. These styles can include the choice of fonts, the use of colors, the placement of text, and other design elements. These similarities are not necessarily conscious choices on the part of the cartographer or publisher, but rather reflect the conventions of the time and the particular tools and techniques available.
Additionally, tt has been observed that text spotting models fine-tuned on synthetic maps can achieve better performance on historical maps. This means that by training models on synthetic maps that reflect the styles of historical maps, researchers can improve the accuracy of automated text recognition on real historical maps.
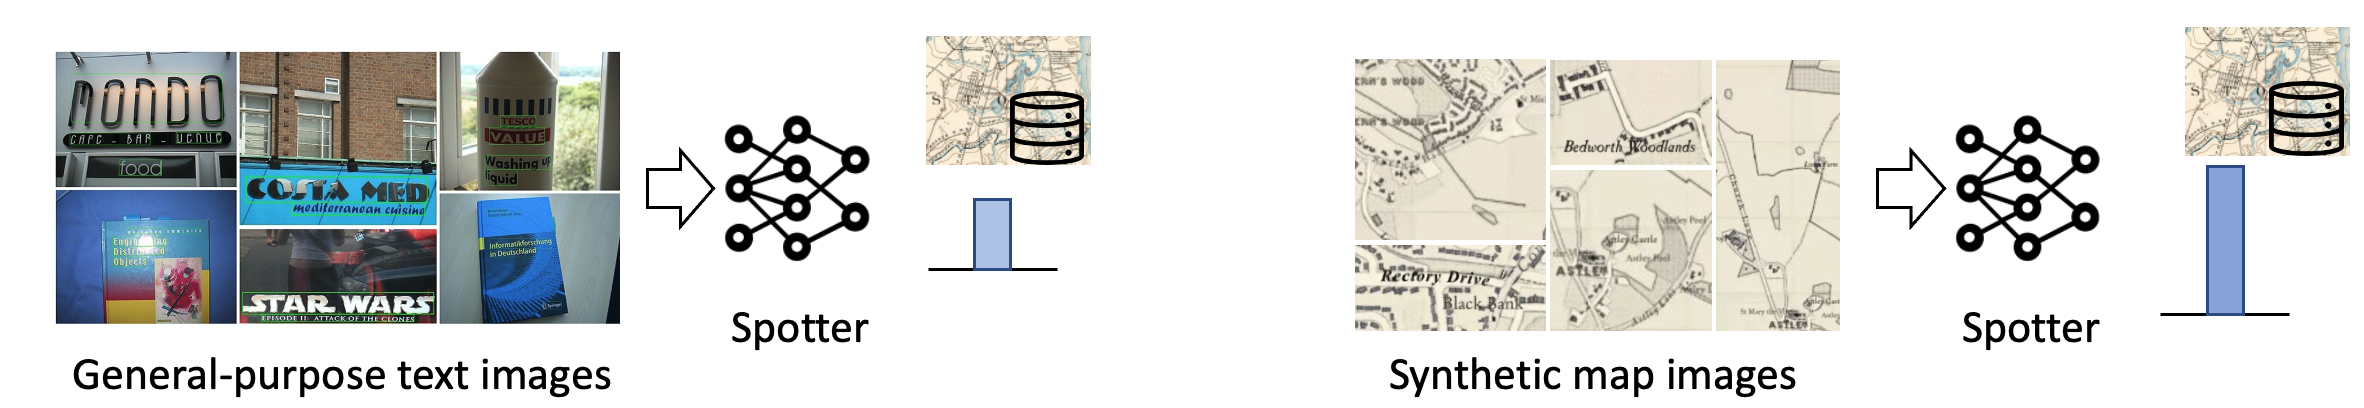
So we would natually want to create synthetic maps for major map styles and train corresponding text spotter models
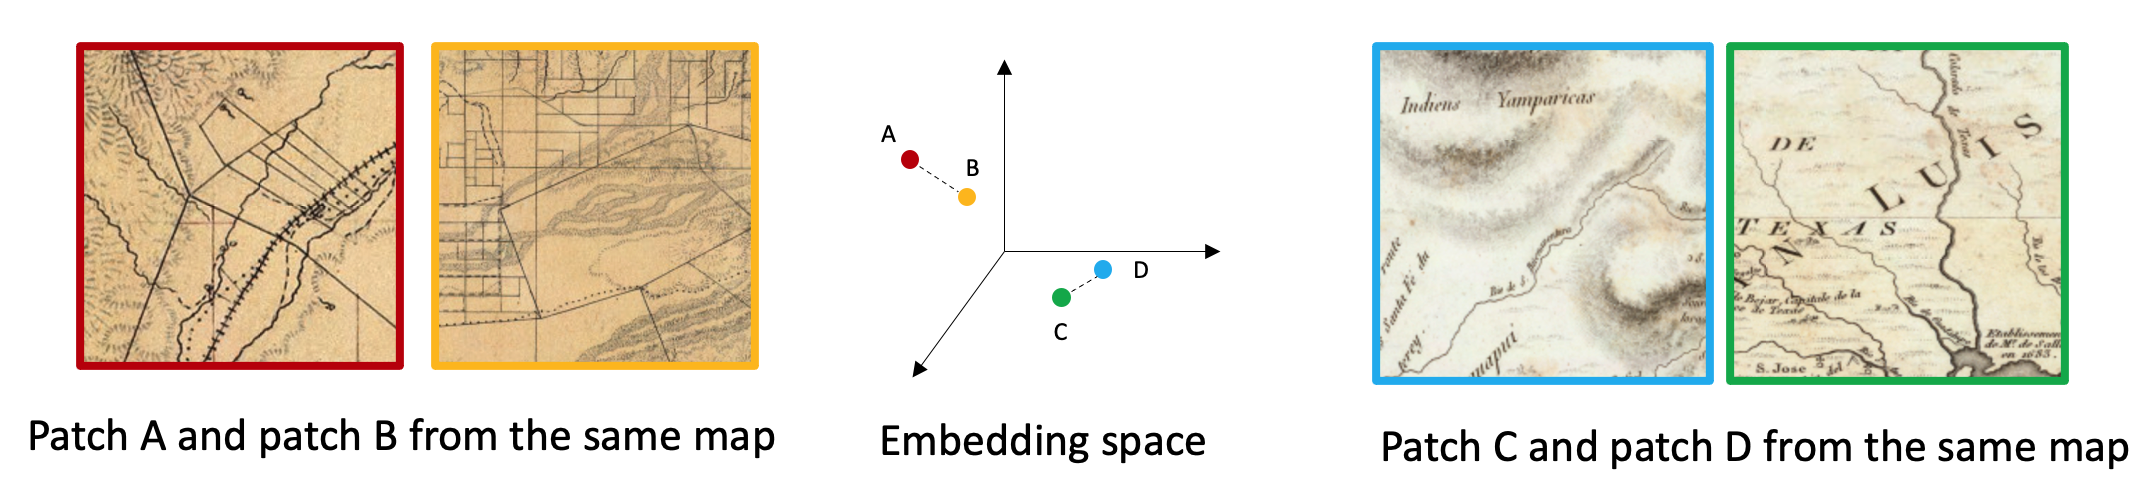
Our grouping method is based on the assumption that hidden features extracted from DNN capture the shared styles amoung patches.
To enable the DNN to learn style-aware features, we train the DNN with the following procedure
Data source:
- 56507 map images from David Rumsey map collection (skip empty)
Training samples:
- Randomly sample two 1000x1000 patch from each map
- Avoid sampling from image border
- Batch size 64
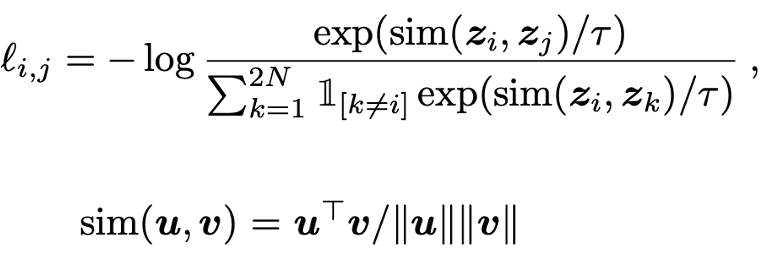
The loss function we use is N-pair Loss
After training, when visualizing the patch feature vectors with t-SNE, we can see that patches from the same map are grouped together, and patches from different maps are quite far away:
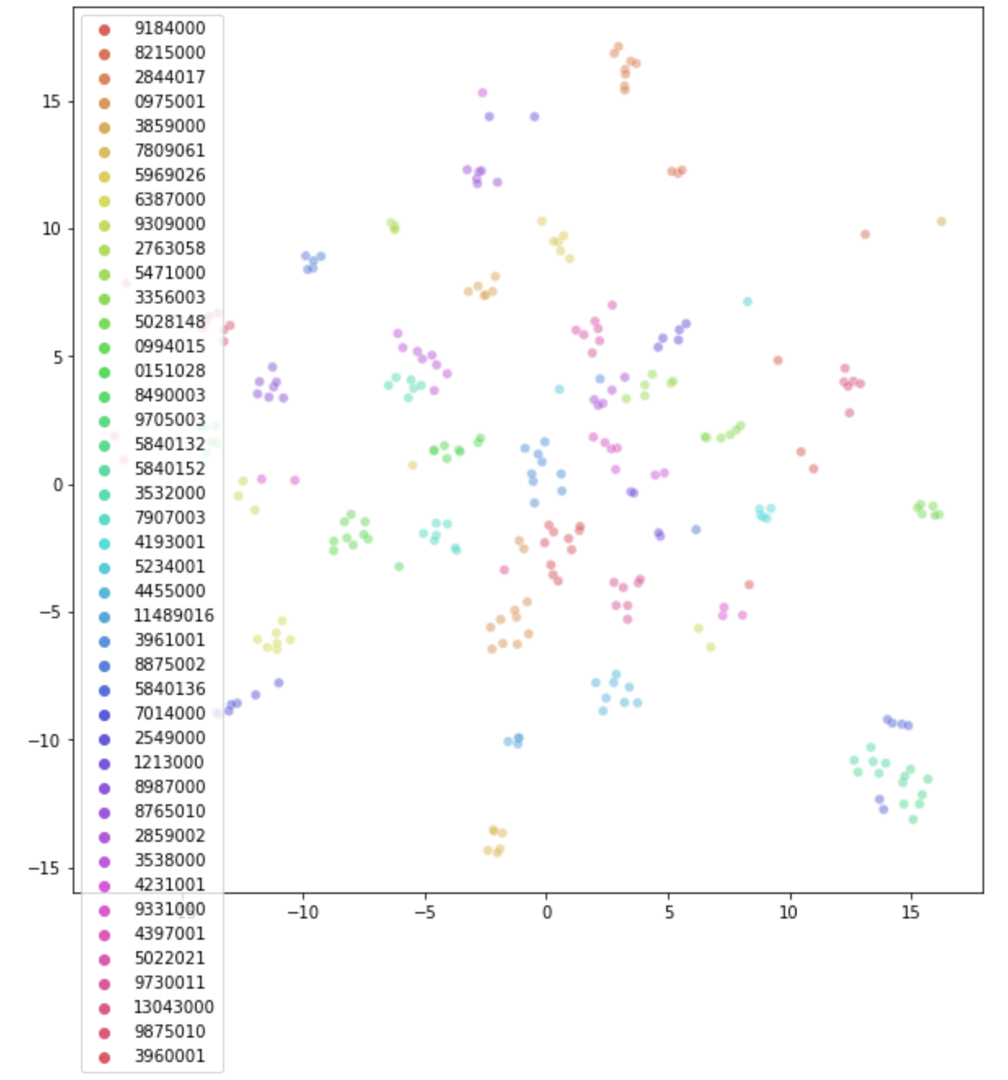
We then average the patch-level features to obtain the map-level features, and then run DBSCAN to cluster map-level features and group them into clusters. The advantage of DBSCAN is that we don't need to specify the number of clusters, and the algorithm will determine that automatically based on the distance threshold.
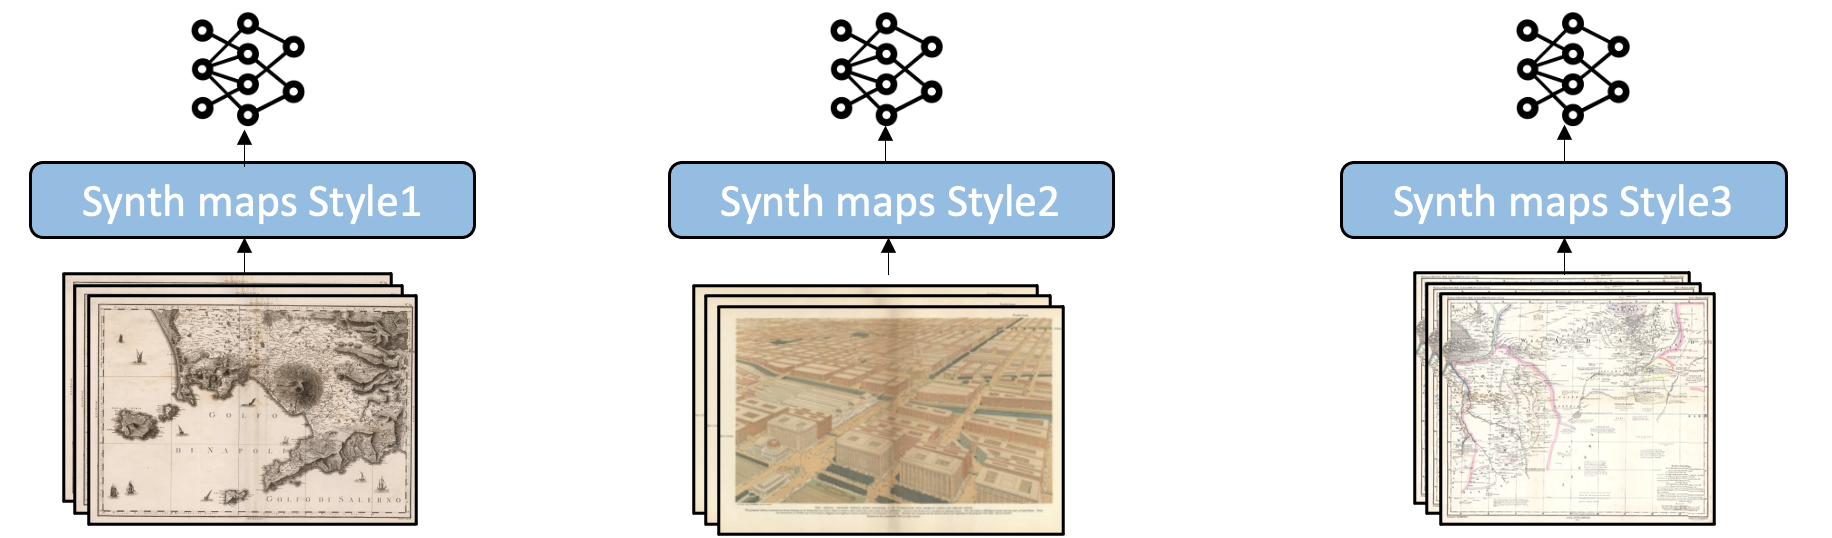
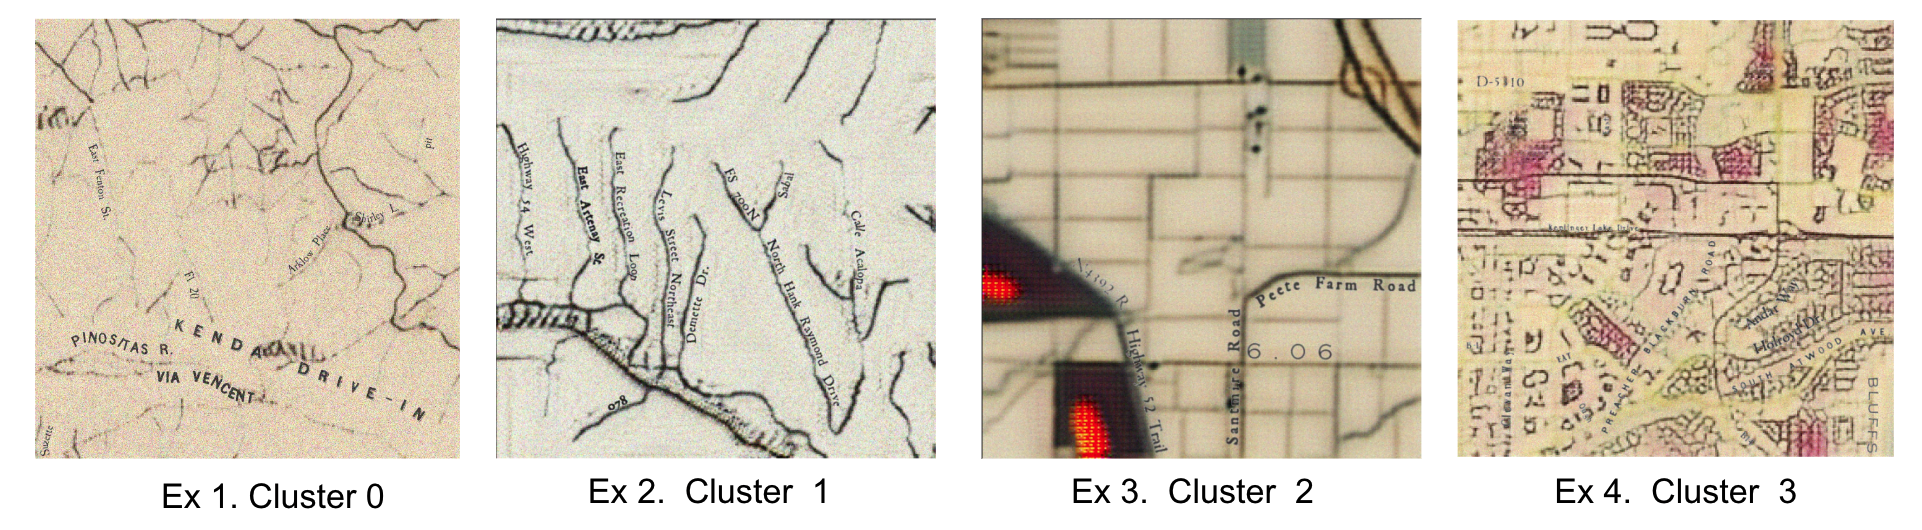
DBSCAN gives us ~70 main clusters in total, and conducted further experiments on the top-4 clusters with the most number of maps.
We use the same method proposed by Li et al. 2021 and train CycleGAN to generate map backgrounds, and use QGIS python API to overlay the text labels on the map backgrounds.
Some sample images from each cluster are shown here:
Reference
@inproceedings{li2021synthetic,
  title={Synthetic map generation to provide unlimited training data for historical map text detection},
  author={Li, Zekun and Guan, Runyu and Yu, Qianmu and Chiang, Yao-Yi and Knoblock, Craig A},
  booktitle={Proceedings of the 4th ACM SIGSPATIAL International Workshop on AI for Geographic Knowledge Discovery},
  pages={17--26},
  year={2021}
}