Conditional Logic Result not being read as number #196
Description
Hi,
Hoping you can assist, I've been using this plugin to pull data from our ThousandEyes API and graph it.
While playing around with the best ways to make interactive dashboards, I've come across a small issue with the JSONata interpretation by Grafana.
Explained:
Below is a screenshot of my query
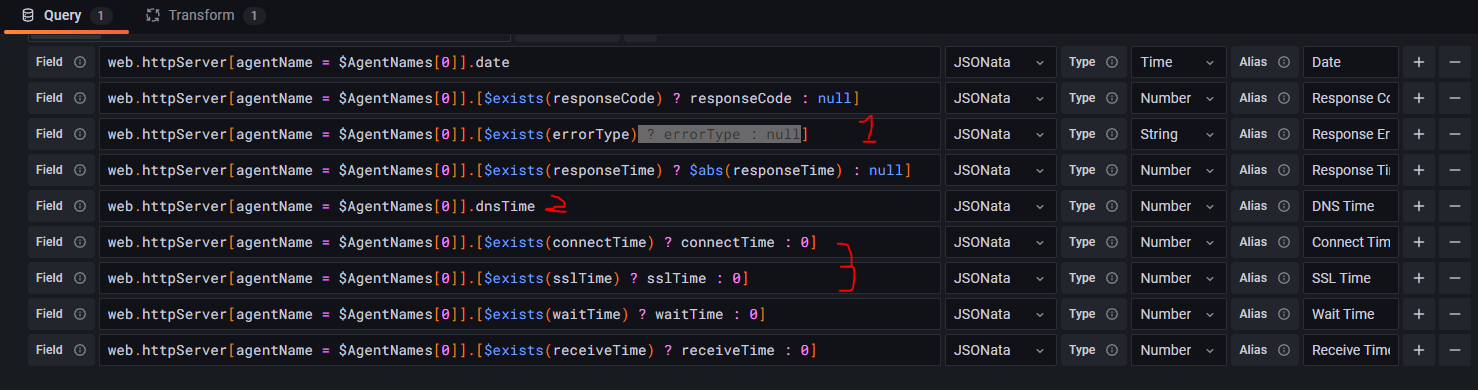
at:
1 & 3 - you will see me using conditional logic, this is because depending on the type of Test we select, we may see a metric present for 1 or not present for the other.
In simple terms, a metric like sslTime, is sometimes present in the json data, and sometimes it is not. To get around this I used conditional logic. (On our Table this is not seen as a number, and cannot have units applied to it or be graphed on separate panels)
2 - you will see me using a plain query instead of conditional logic. (On our Table this is seen as a number and is able to have a unit applied to it)
Below is a screenshot of the table, you will see DNS Time has (ms) applied to it, this is because only this query result is being seen as a number, being able to be graphed.

I am unsure if this is an expected result using conditonal logic, but if there is a way to fix this or work around it,
I would be grateful for assistance.
Regards,
Me