@mtennekes -- would you be able to let me know what is the scope and limitations of the extra.ggplot2 argument in the charts functions? For example, I've tried to use the dark theme, and the whole chart is not longer readable. Thus:
- What is the scope of this argument?
- Is it possible to specify a few ggplot2 options with it?
library(tmap)
library(spData)

tm_shape(nz) +
  tm_polygons("Median_income",
              fill.chart = tm_chart_histogram())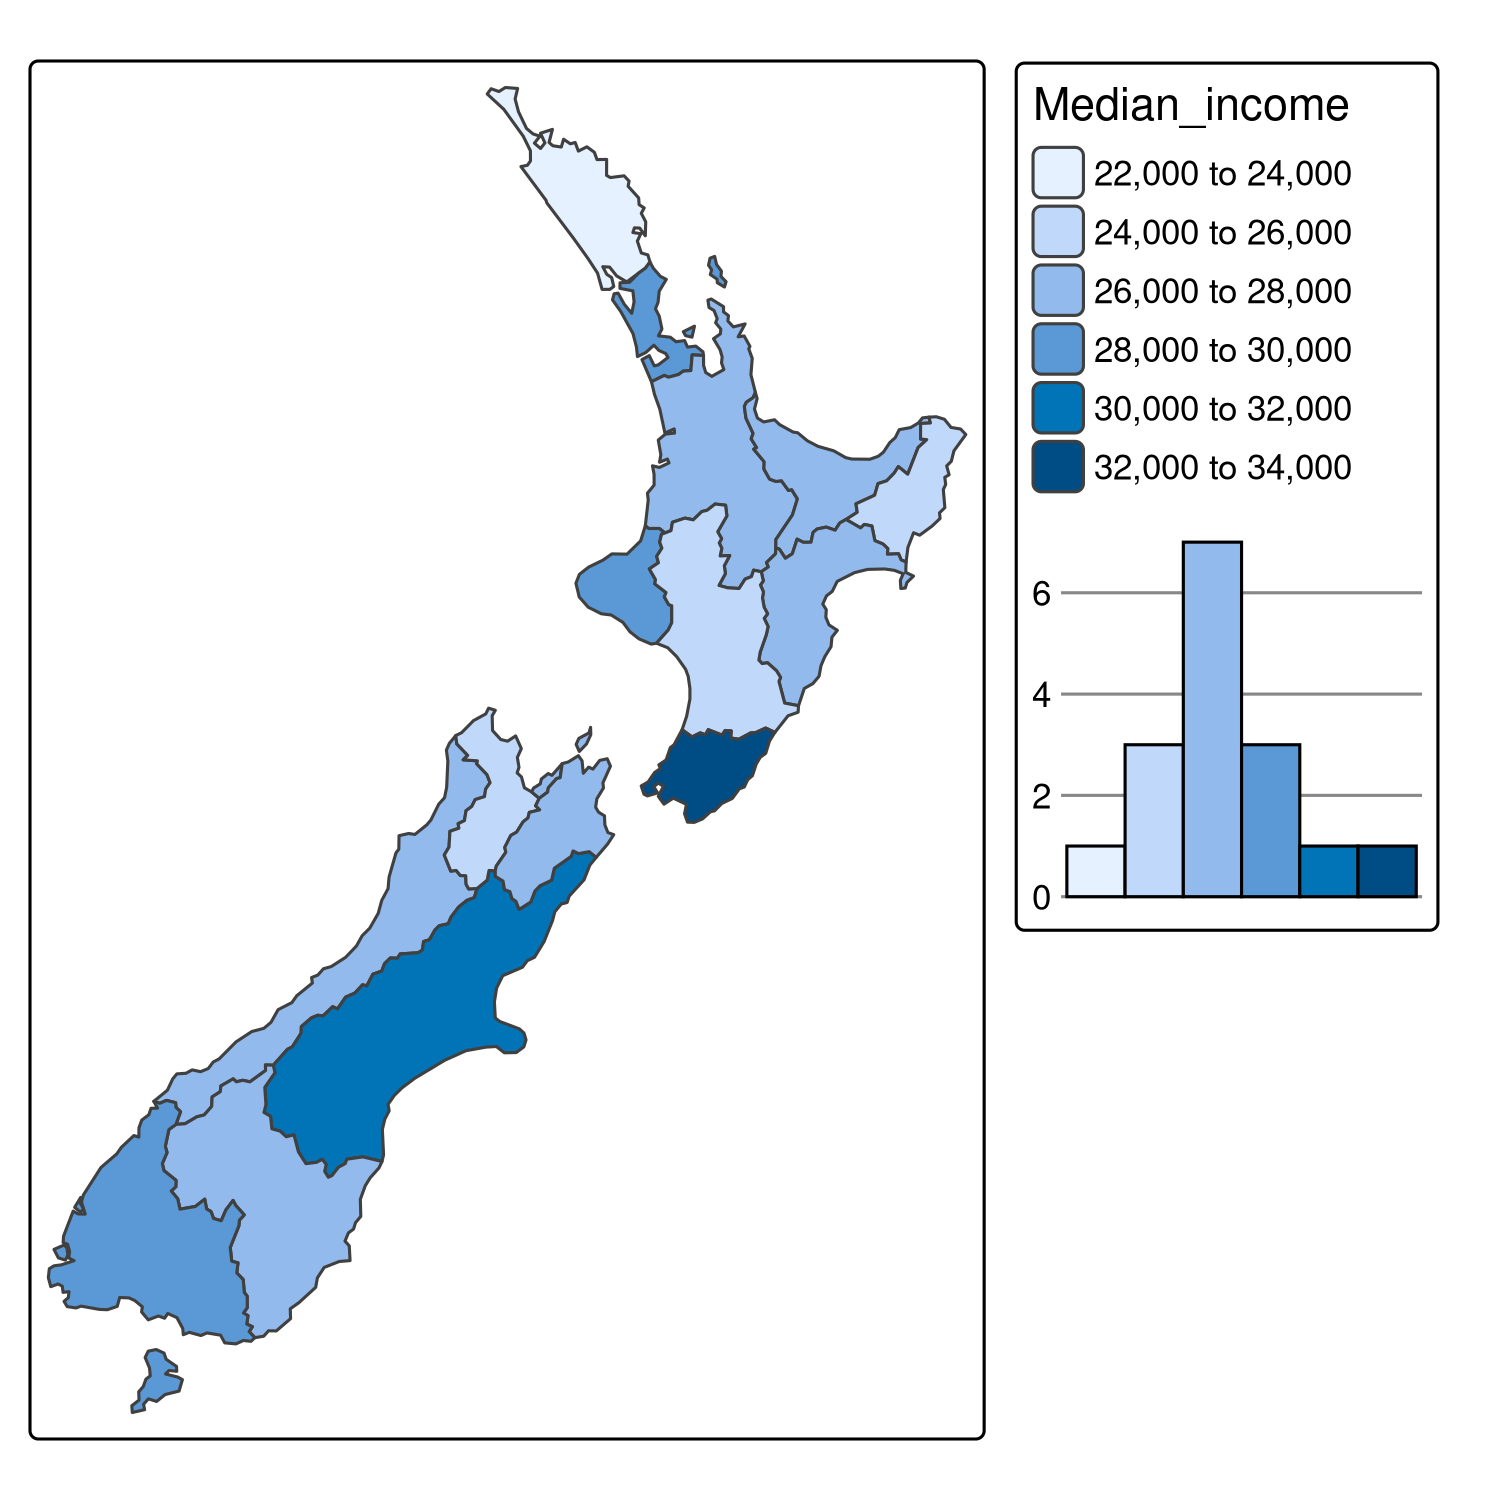
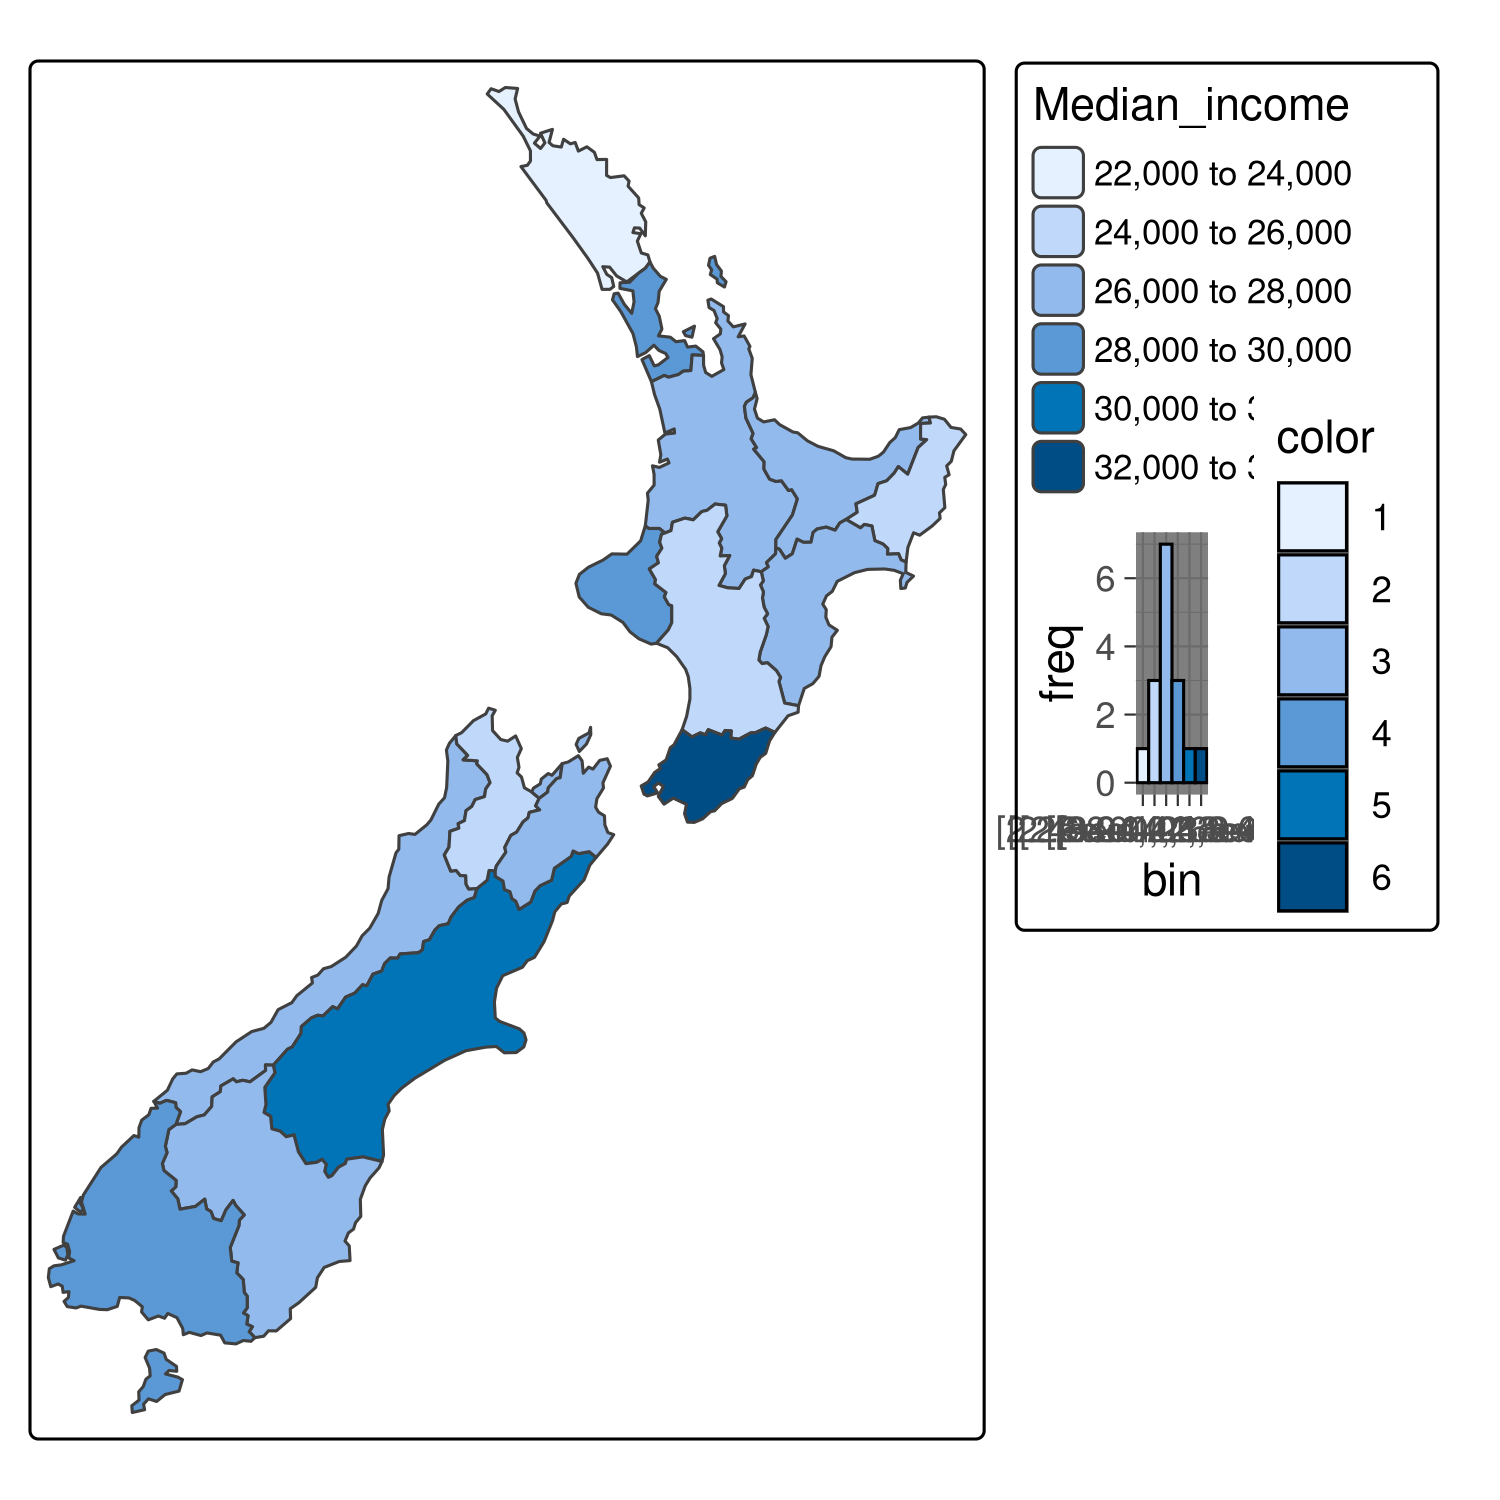
tm_shape(nz) +
  tm_polygons("Median_income",
              fill.chart = tm_chart_histogram(
                extra.ggplot2 = ggplot2::theme_dark()
              ))
Created on 2025-06-24 with reprex v2.1.1
@mtennekes -- would you be able to let me know what is the scope and limitations of the extra.ggplot2 argument in the charts functions? For example, I've tried to use the dark theme, and the whole chart is not longer readable. Thus:
Created on 2025-06-24 with reprex v2.1.1