Users can issue spreadsheet formulae on the overview to compute aggregates for the data in each bin. The results are displayed as an aggregate column. Each entry in the aggregate column corresponds to the adjacent bin in the current granularity of the overview. Users can issue several formulae simultaneously.
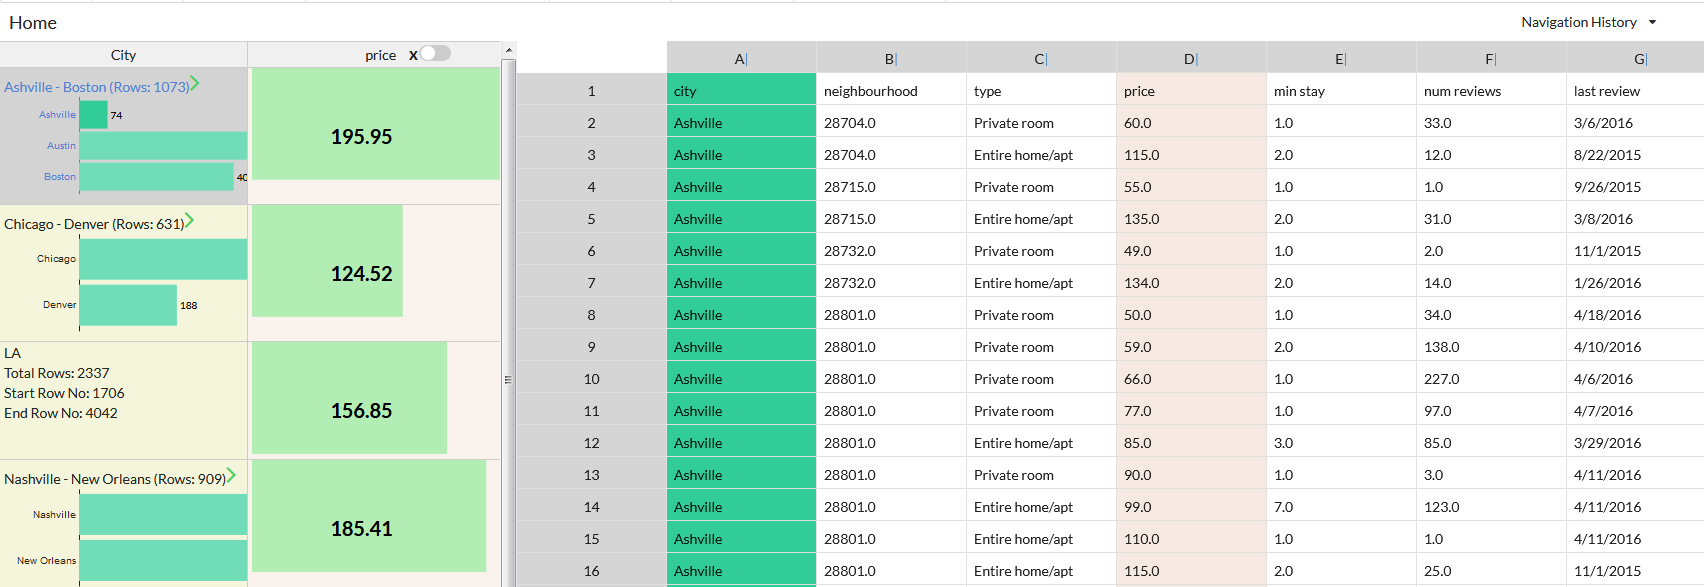
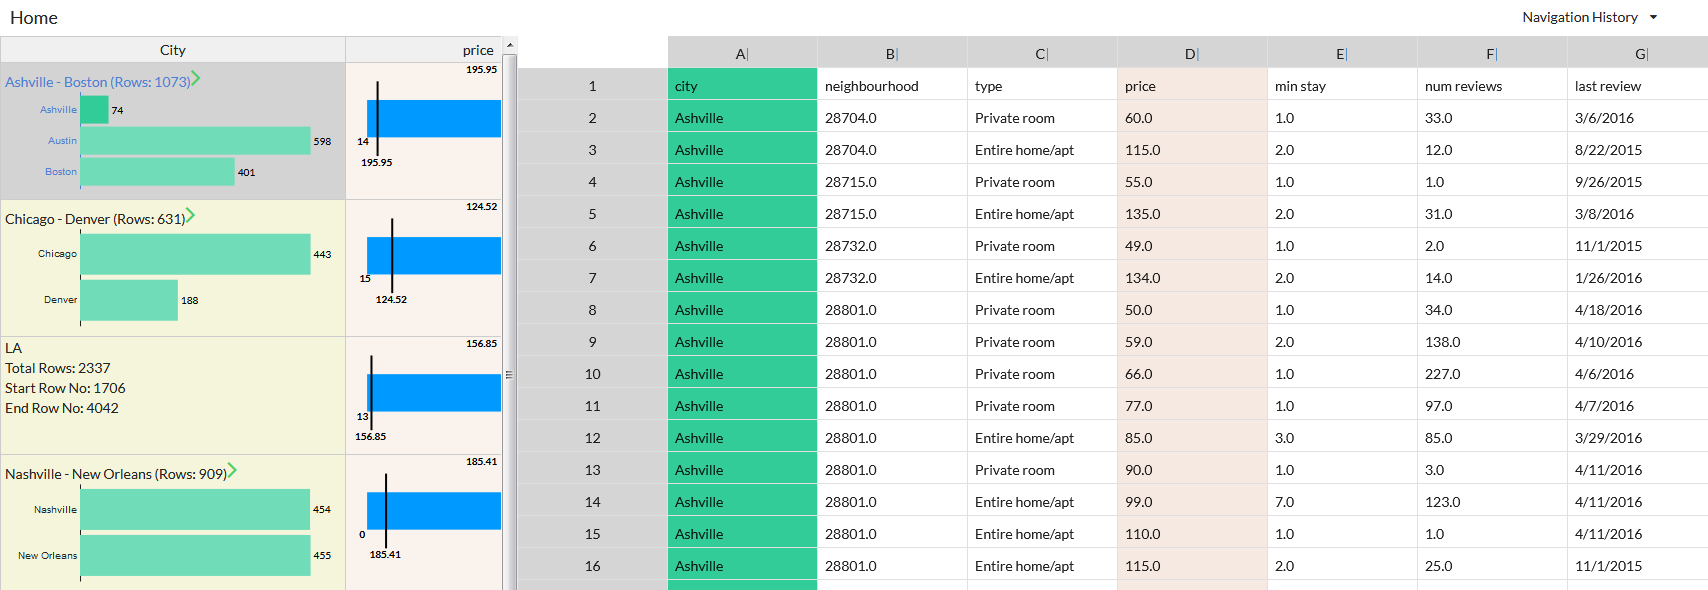
Users can choose to view the result of formulae either as raw values or charts and can toggle between the two. Raw values are displayed along with a colored bar called value bar whose length is proportional to the corresponding aggregate; users can use the lengths to visually compare across bins. The chart representation varies depending on the formula type.
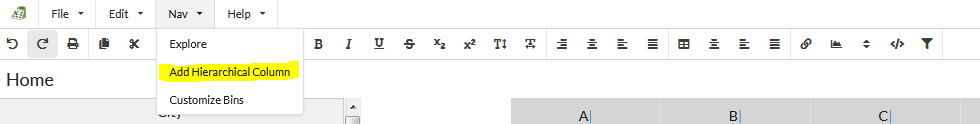
Step 1: From the menubar select Nav -> Add Hierarchical Column.
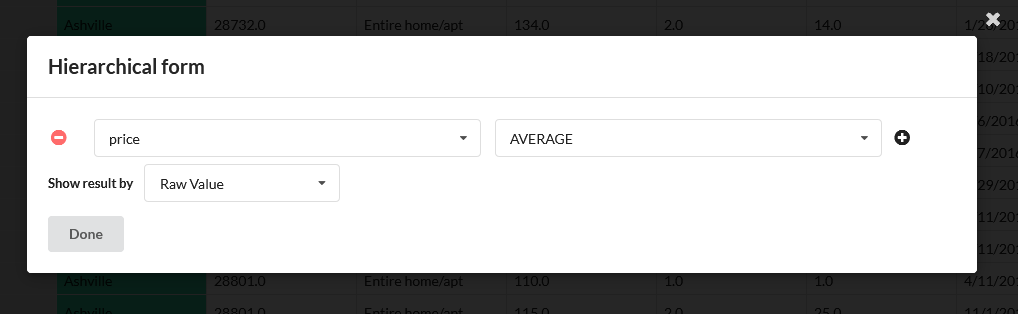
Step 2: Select the aggregation attribute and suitable spreadsheets formula. Then choose whether you want to view the results as raw text or charts.