- Python version : 3.9.9
- Operating system : MacOS 12.0
Description
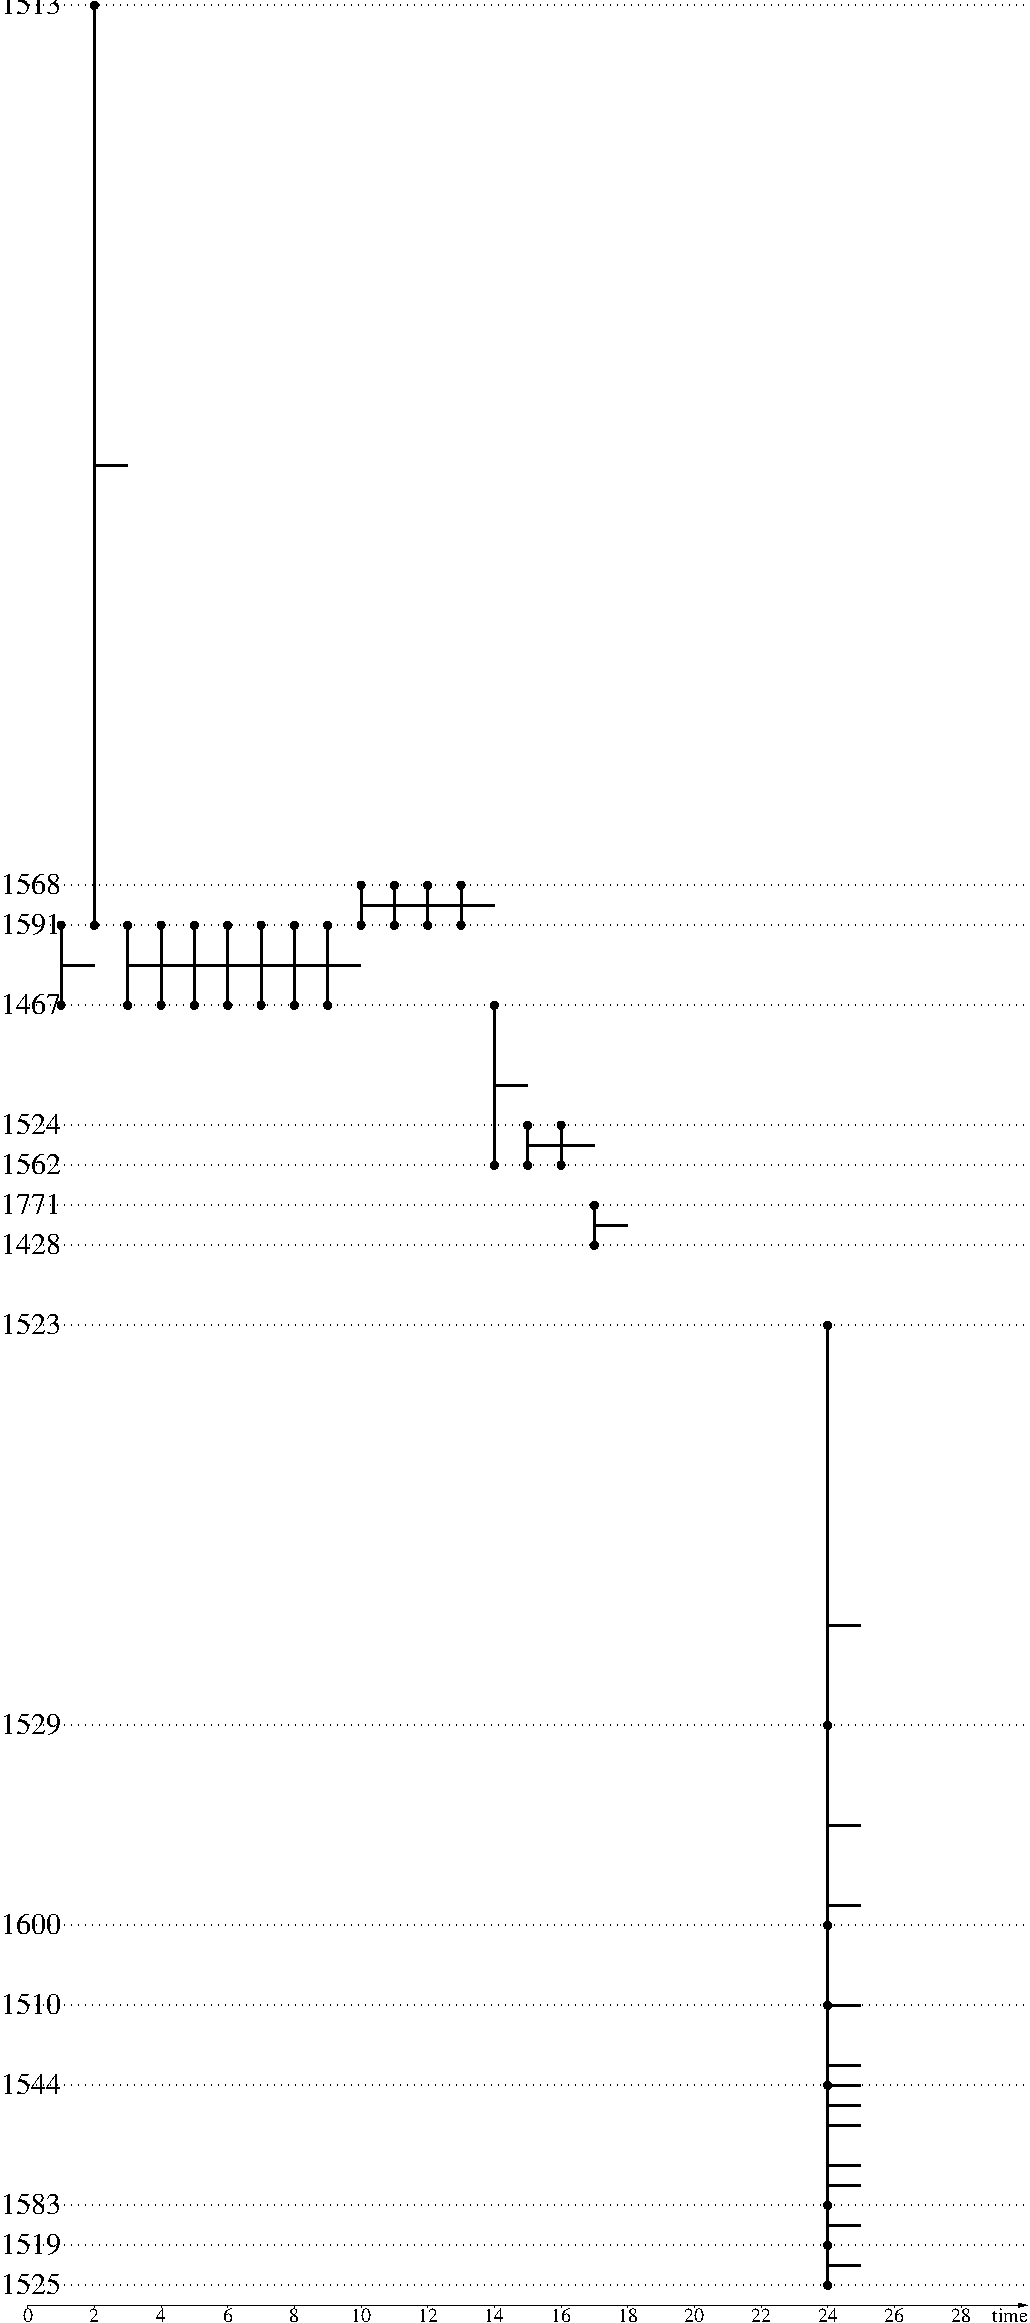
After populating a Streamfig object with duplicated nodes (i.e adding same node label several times), the .png image generated by the library has an oversized height, with empy spaces between node labels (see image below).
What I Did
I installed streamfig library using pip:
I ran the following script, which :
- imports stream data in the form a list of temporal events, i.e list of triplets
) corresponding to event between nodes
corresponding to event between nodes  and
and  at time
  . Data is available in
 .csv file at end of this post.
- iterates over the stream and :
- adds nodes and to
Streamfig object. Note that and may be duplicated over the stream, and thus are added several times.
- adds each link between nodes and at corresponding timestamp.
- saves figure
To run the script :
python my_script.py; fig2dev -Lpng streamfig_sf2h.fig > streamfig_sf2h.png
my_script.py
import streamfig

# Import data
with open('SF2H.csv', 'r') as f:
    lines = f.read().splitlines()

# Initialize streamfig
s = streamfig.StreamFig(alpha=0, omega=30)

# Add nodes and links to streamfig
for event in lines[1:]:
    src, dest, t = event.split(',')
    s.addNode(str(src))
    s.addNode(str(dest))
    s.addLink(str(src), str(dest), float(t), float(t)+1)

# Add Timeline
s.addTimeLine(ticks=2)

# Save .fig
s.save('streamfig_sf2h.fig')
Note
When populating the Streamfig object with lists of unique nodes, the height of the image is not oversized.
DATA
SF2H.csv
Description
After populating a

Streamfigobject with duplicated nodes (i.e adding same node label several times), the.pngimage generated by the library has an oversized height, with empy spaces between node labels (see image below).What I Did
I installed
streamfiglibrary using pip:I ran the following script, which :
.csvfile at end of this post.Streamfigobject. Note thatTo run the script :
my_script.pyNote
When populating the
Streamfigobject with lists of unique nodes, the height of the image is not oversized.DATA
SF2H.csv