Debugging with DebugView
The PSF is written to output information in certain situations to the debug console port. This information is easily viewed by running the SystemInternals tool 'DebugView'. DebugView is typically run from outside of the container to monitor what the PSF is doing. Other software also uses the debug port and their events may be intermixed with those of the PSF, but the PSF entries are generally recognizable once you have viewed some of it. For example, the Microsoft AppInstaller GUI used to install UWP/MSIX packages emits events to this port.
The primary use of debugging an MSIX package that contains the PSF is to monitor the actions of PsfLauncher. PsfLauncher always emits logging information about its activities to the debug console port. The PsfRuntime dll, which is used in PsfLauncher and target application processes also always emit logging information about their startup and the launching of any child processes.
For performance reasons, the normal release build of PSF Fixup dlls do not emit to the console debug port. However the debug versions of those Fixup dlls emit a lot of information when used. This is primarily of interest to a developer working on the Psf, but it might be enlightening to others to better understand their issue.
Below is a typical startup of a MSIX package with the PSF:
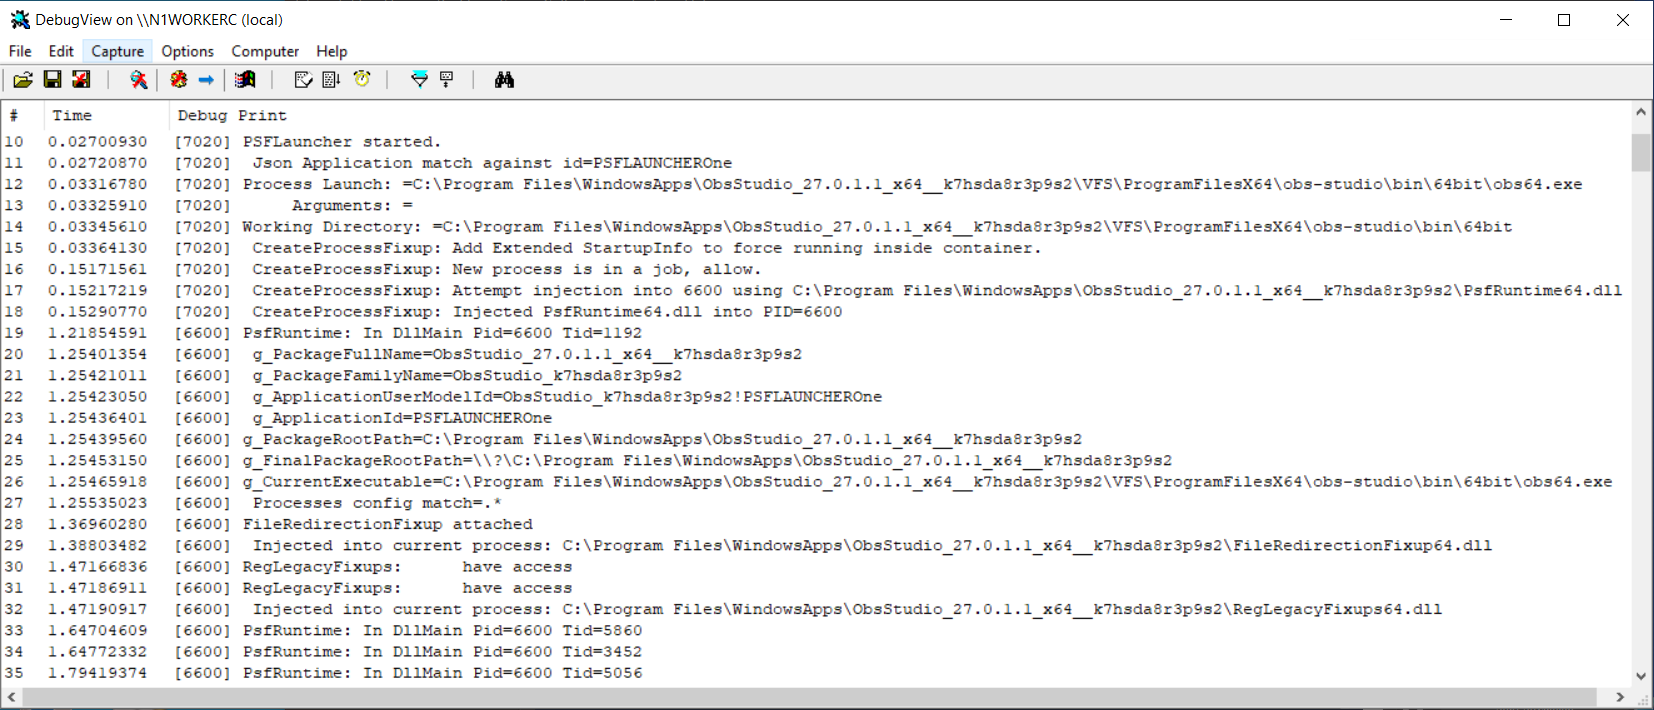
Keep in mind that the information emitted will vary from time to time as the PSF evolves. The text on each event, such as [7020] is the Process ID that generated the event. In our case this is a file called Psflauncher1.exe. Information on some of those events are:
- The event on Line 10 of the image is when the launcher started.
- On line 11, the config.json file has been read in and the Applications section processed to find a matching id to our process name.
- Lines 12-14 show information about the target application to be launched.
- Lines 15-18 contain information about how the new process (the target application) will be started and how the PsfRuntime dll will be injected into it.
- Lines starting with line 19 are the new application process (note the change in Process ID to 6600).
- Lines 19-26 are boilerplate from the PsfRuntime dll to show that it is running in the new process and what MSIX Package information is available from the container.
- We may (but do not in this trace) see information about PsfRuntime searching to find the config.json file. If present in the trace we would only care if it were not eventually found.
- Line 27 indicates that the config.json file has been read by this new process, and that the processes section has found a match in the file that contains the desired configuration.
- Lines 28-32 show the additional fixups being loaded in.
- In the release build, only the start of additional processes inside the container, new threads being added or removed from managed processes, and some final messages from the PsfLauncher process (as it shuts down after the target application completes), should appear from the PSF.