Supply system-level results for all granularities #195
Description
I would like to be able to plot the system-wide results that come from the compare workflow. If I upload site level actual performance, I will want to compare to site level weather adjusted, but the only options are inverter level.
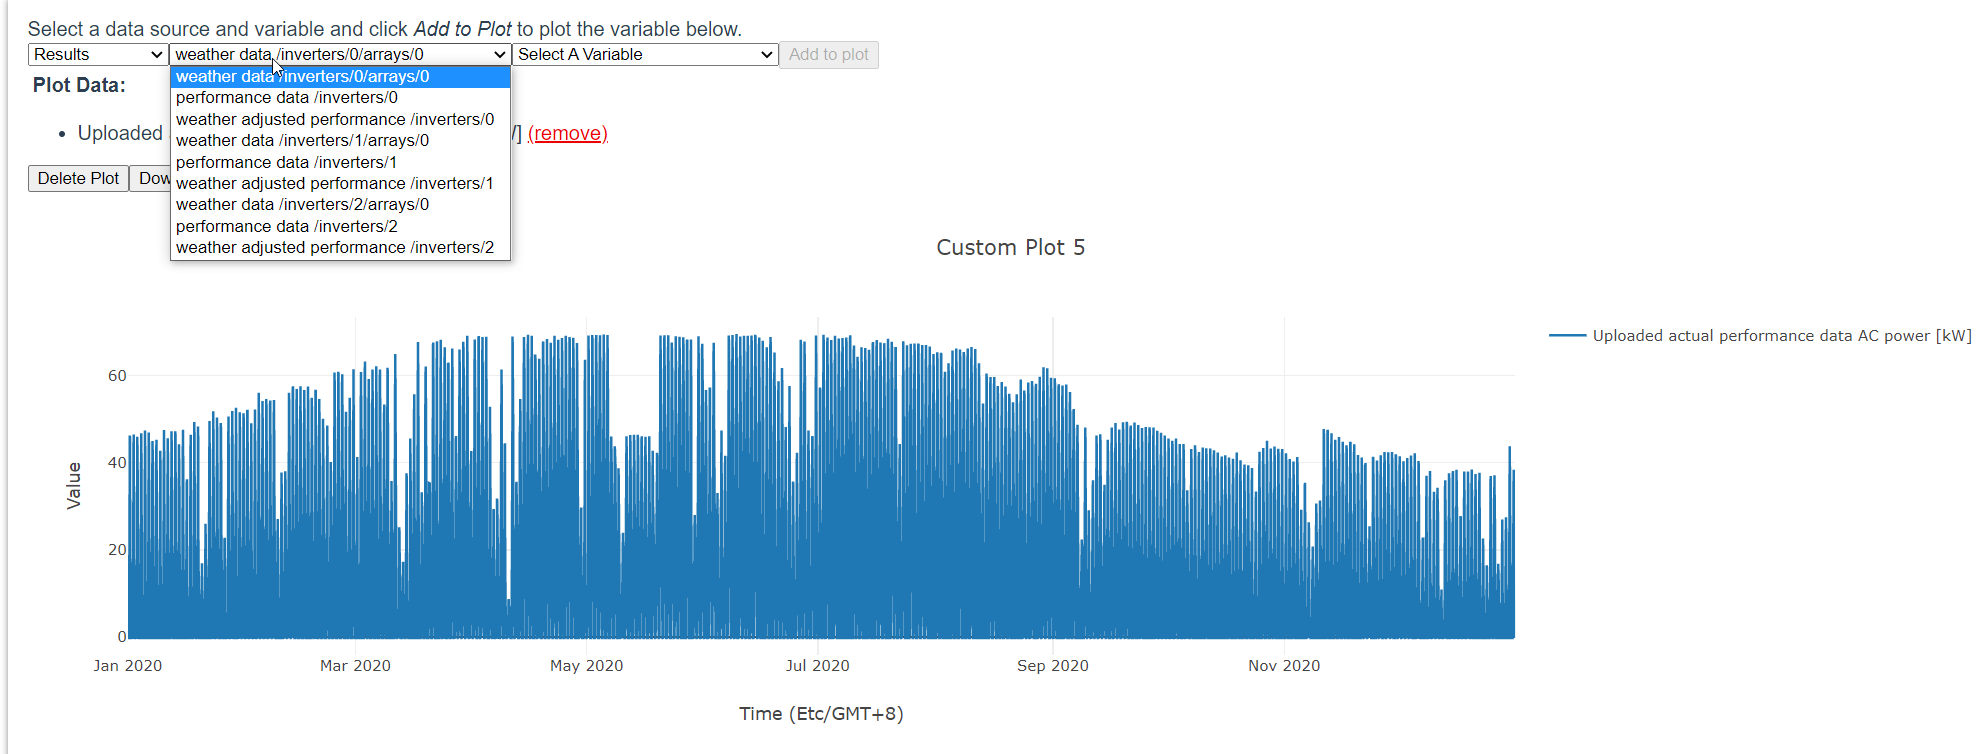
I can add all the inverters but that does not make for a very useful graph.
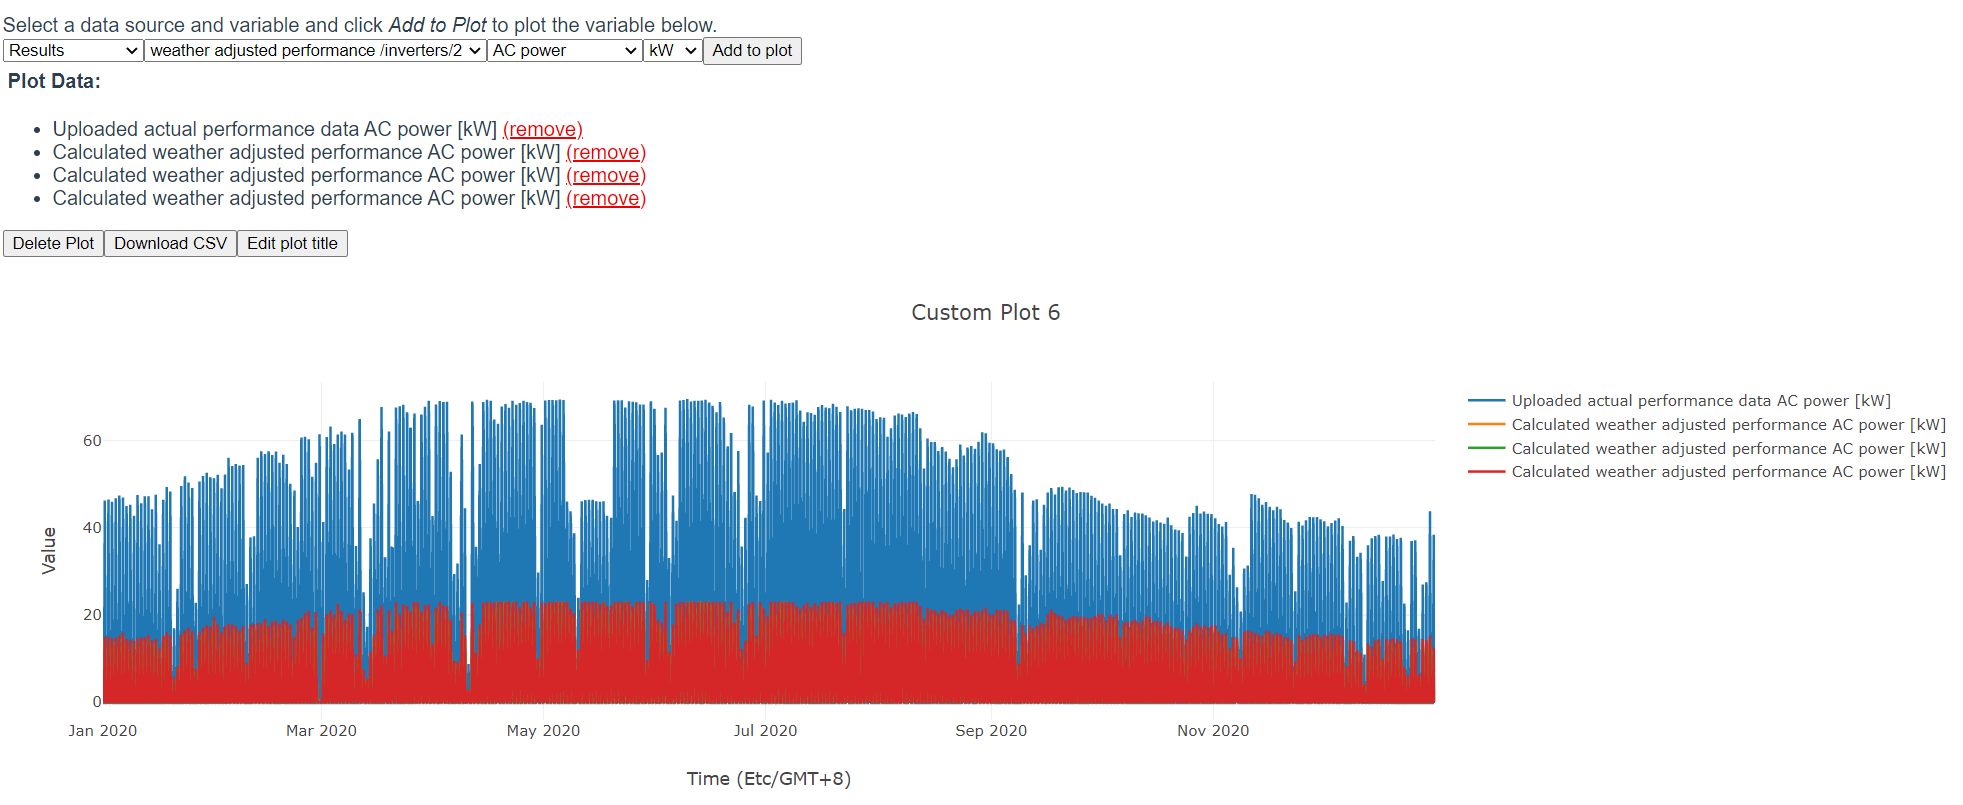
And I could download the inverter level results and sum them myself and make my own graph, but I would like the tool to be able to do that.
Originally posted by @ncroft-b4 in #180 (comment)