- Background
- Issues with Ray Distributed Debugger in Kuberay Environment
- Technical Exploration
- Deployment Example
- Conclusion and Reflections
In software development, debuggers with step-by-step capabilities are crucial tools for improving development efficiency. For complex distributed systems, step-by-step debugging is particularly important as it helps developers quickly locate issues within intricate synchronous/asynchronous code paths, thereby shortening problem diagnosis cycles.
Taking distributed storage systems as an example, in 2021, I configured step-by-step debugging capabilities for Apache IoTDB 3C3D clusters through IDEA (refer to my blog). In the following years, this approach helped me solve numerous challenging issues in IoTDB distributed development, enhancing development efficiency.
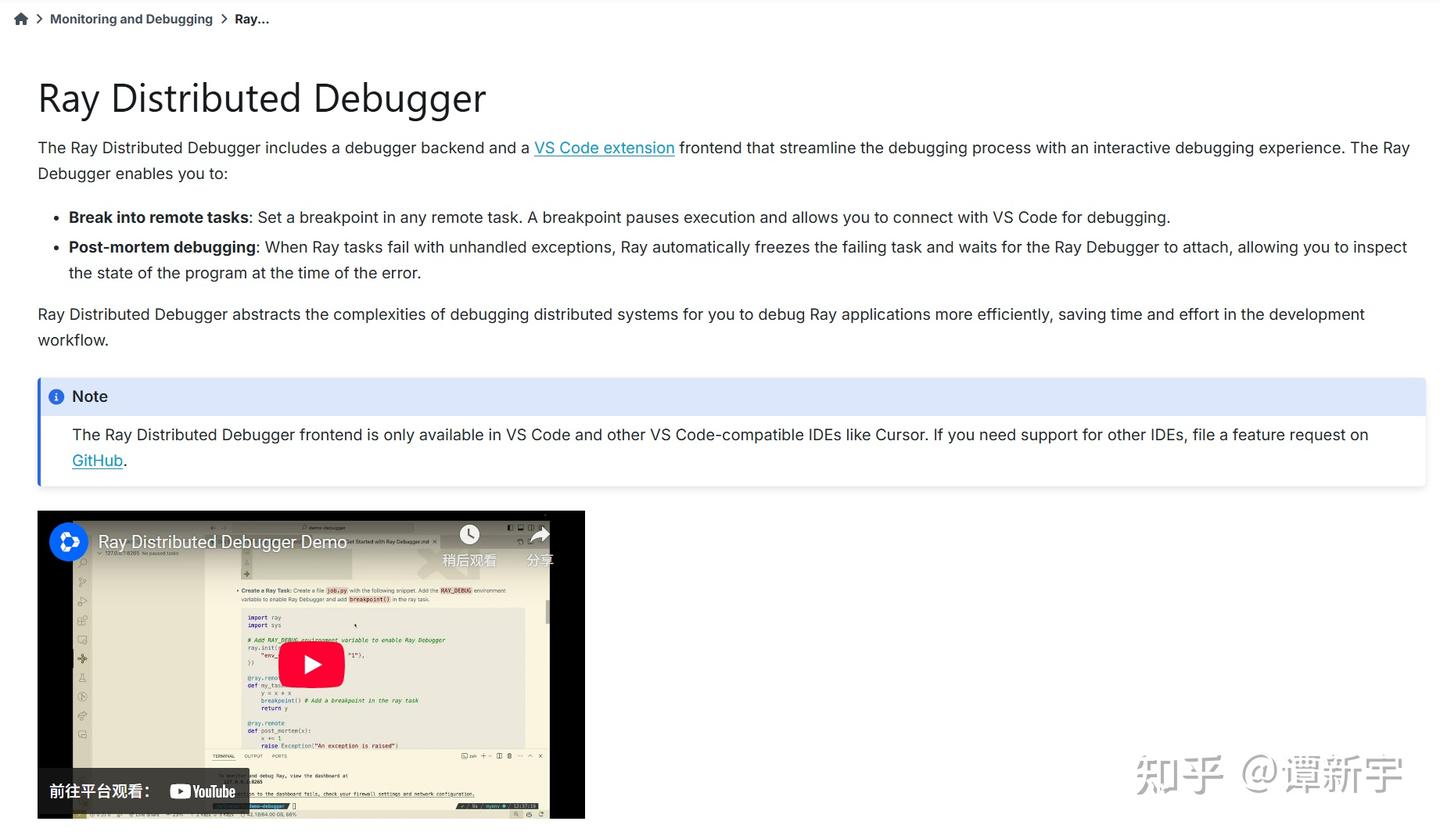
Recently, I began learning and researching the Ray distributed computing framework, starting with its debugging functionality. Ray officially supports two types of debuggers, with specific usage instructions available in the official documentation. Here's a brief introduction:
- Ray Debugger: Performs step-by-step debugging through the Ray debug command, reusing the pdb session command line. It has been marked as deprecated since version 2.39 and is not recommended for use.
- Ray Distributed Debugger: Performs step-by-step debugging through a VSCode plugin, reusing the pydebug graphical interface for a better experience. It is currently the default debugging tool recommended by the Ray community.
Note: Ray Cluster must be configured with the appropriate Debugger parameters at startup, and the two Debugger types cannot be used simultaneously.
The core principle of Ray Distributed Debugger is based on the RAY_DEBUG environment variable that is enabled by default in the Ray kernel. When a breakpoint is triggered, all Workers periodically aggregate breakpoint information to the Head node. The VSCode plugin connects to the Ray Head node to retrieve the breakpoint list, allowing users to click Start Debugging to attach to the corresponding Worker for step-by-step debugging. The official documentation outline is as follows:
As mentioned above, Ray Distributed Debugger needs network connectivity to the Worker that triggers the breakpoint to implement step-by-step debugging. In bare-metal deployment scenarios, this requirement can be met by simply configuring firewall rules. However, with the popularization of cloud-native technologies, most distributed computing frameworks now utilize Kubernetes (K8S) for resource management. In such cases, users typically choose to install Kuberay and control the Ray cluster's lifecycle and resources through custom resources like RayCluster/RayJob/RayServe.
In a K8S environment, due to its network isolation mechanism, the Ray cluster actually runs in an isolated network space inside the cluster, and external entities cannot directly access the various components of the Ray Cluster by default. Ray Distributed Debugger needs to connect to the dashboard port (8265) of the Ray Head node to obtain all breakpoint information. In this case, we can expose port 8265 of the Ray Head to allow Ray Distributed Debugger to access the list of breakpoints triggered in the cluster.
Here's an example of testing Ray Distributed Debugger in a Kuberay environment:
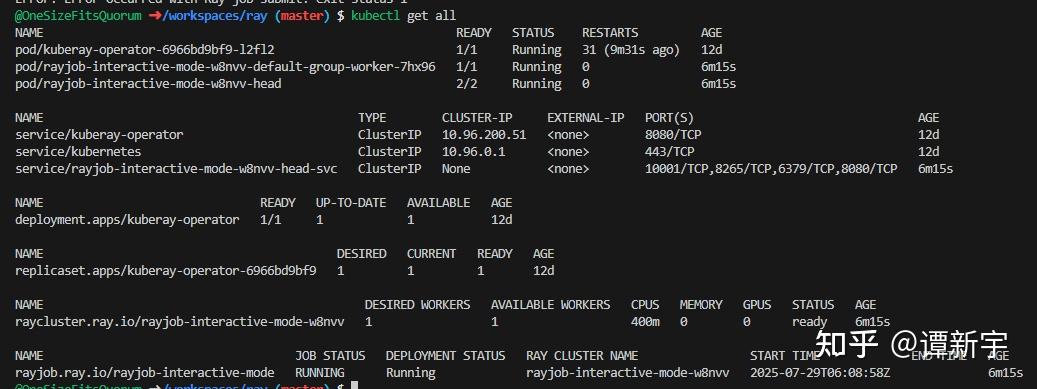
- First, install the K8S cluster and kuberay-operator, then submit a job that will trigger a breakpoint using the RayJob mode.
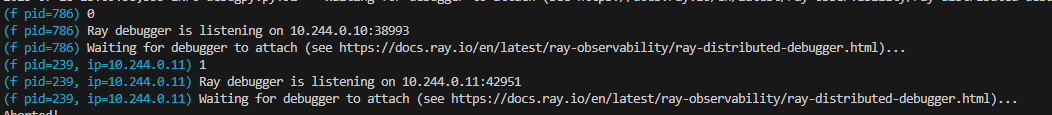
- When a breakpoint is triggered in the code, a log will be printed on the job submitter side, indicating that the debugger is waiting for attachment:
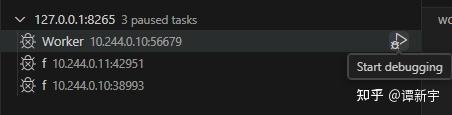
- We use the
kubectl port-forwardcommand to forward port 8265 of the Head node to local port 8265, and connect via Ray Distributed Debugger. At this point, we can see all breakpoints triggered in the cluster:
- However, when attempting to connect to any breakpoint for debugging, the system shows that it cannot attach to the breakpoint, with the following error:
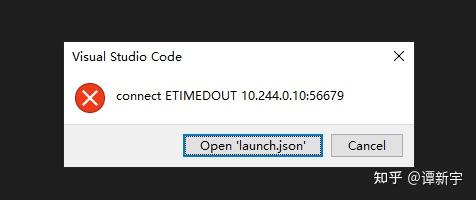
- After analyzing the error message, we found that the problem is that the Ray Distributed Debugger plugin is trying to connect to IP addresses and ports internal to the Kubernetes cluster. These IPs and ports cannot be directly accessed from outside the cluster, and the ports are randomly assigned, making it impossible to map them in advance. This leads to connection failures.
The above example shows that there are practical difficulties in using Ray Distributed Debugger in a Kuberay environment.
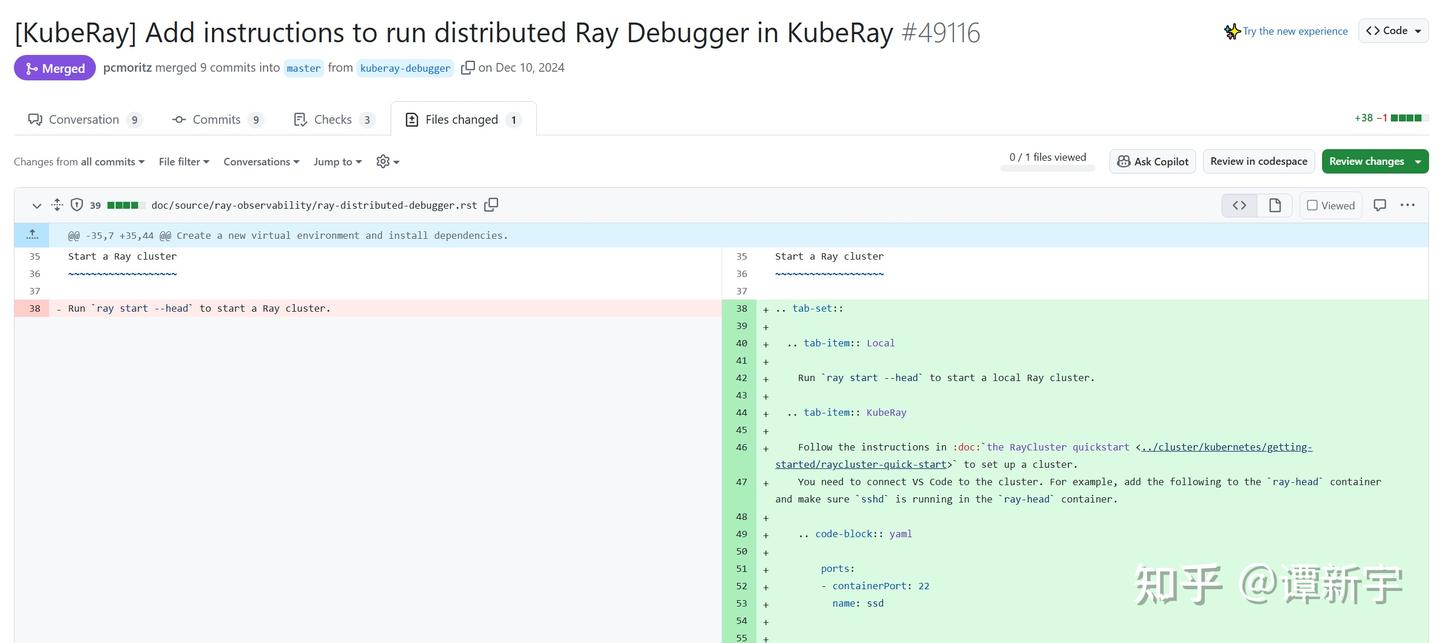
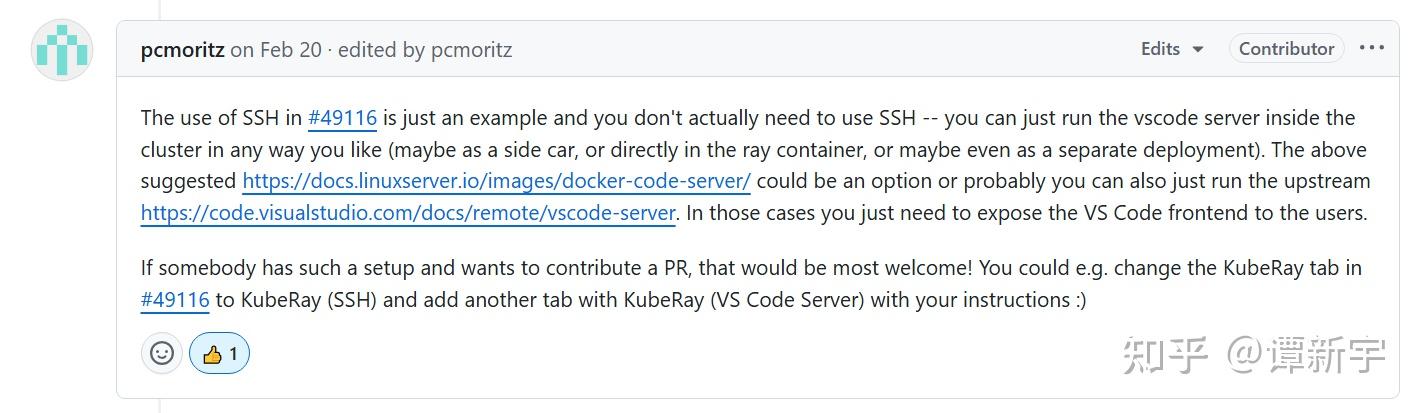
It's worth mentioning that in the official documentation, we also found a PR that proposed a solution involving installing SSH in the Ray Head image and connecting via VSCode Remote. While theoretically feasible, this approach is criticized by users for being complex, involving key management, lifecycle management, and other issues.
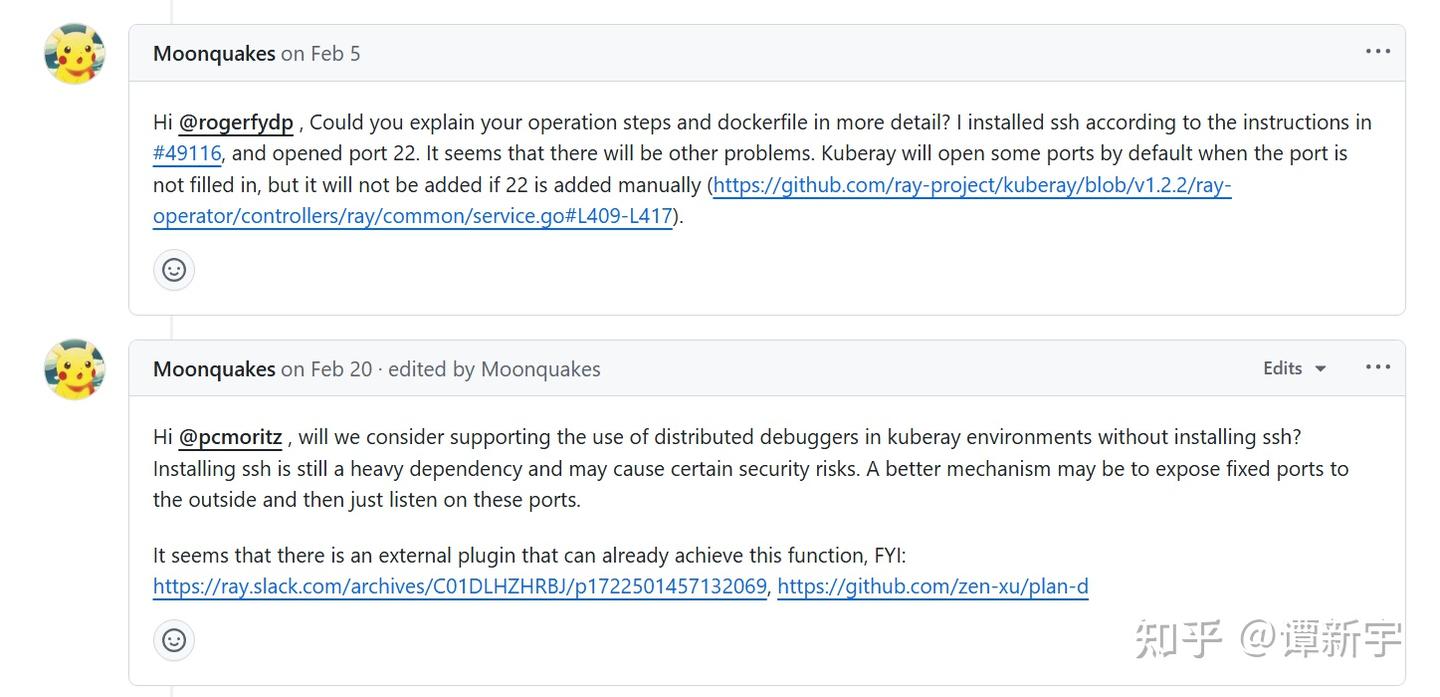
Through analysis, we found that Ray's official support for Ray Distributed Debugger in Kuberay environments is not sufficiently robust, necessitating a more convenient solution.
Is there a convenient way to use Ray Distributed Debugger in a Kubernetes environment? With this question in mind, I conducted some technical research and experimentation.
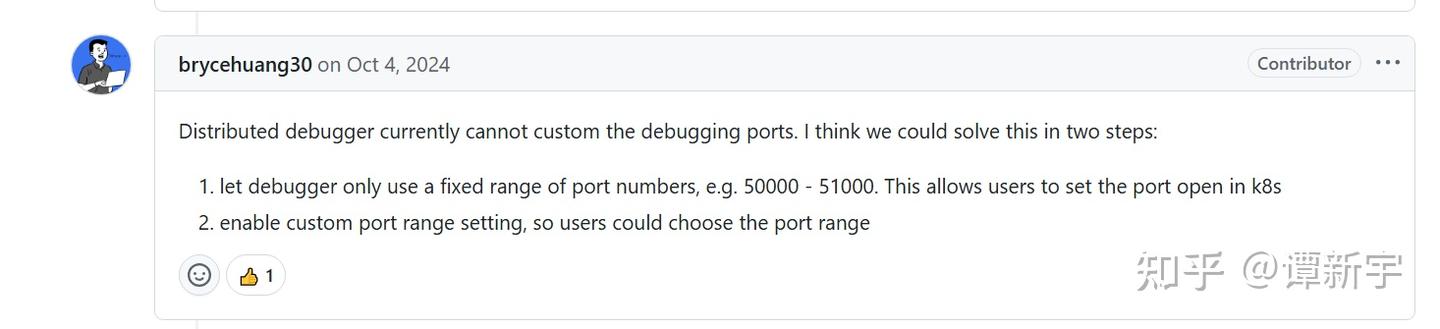
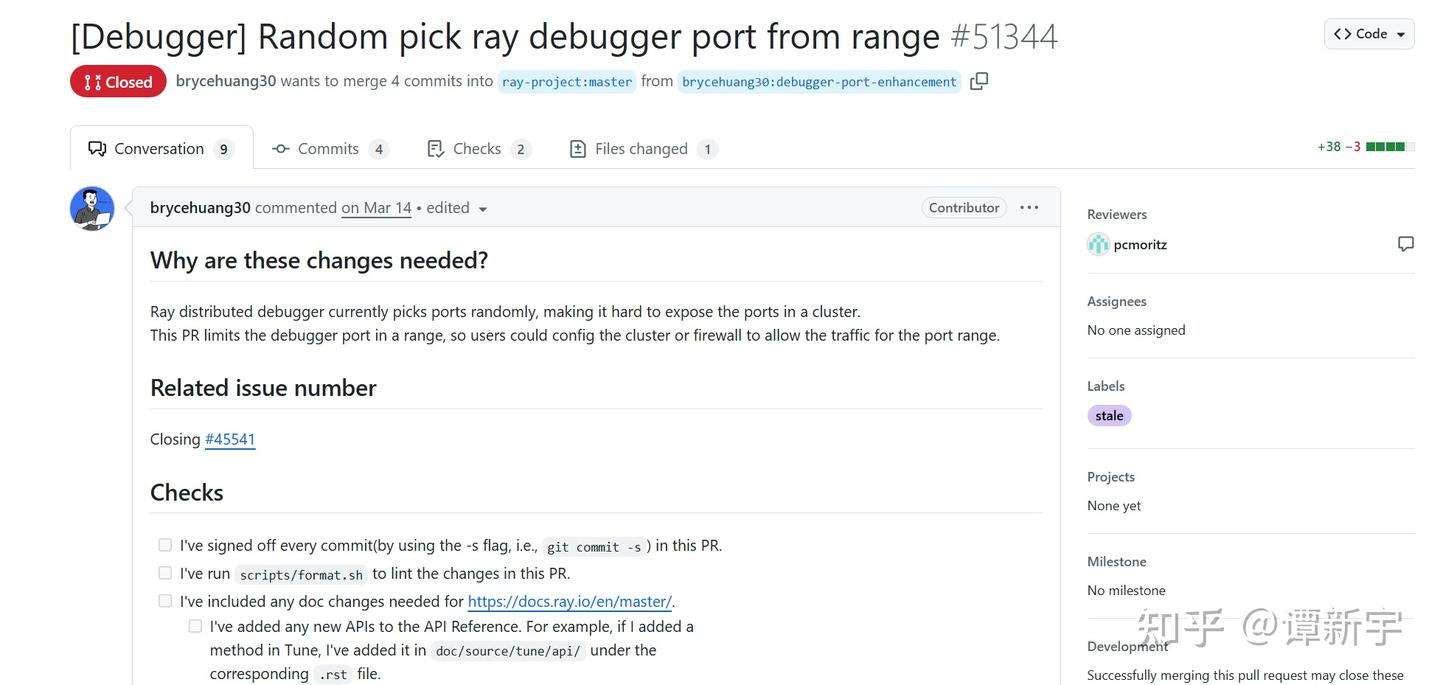
First, I consulted the relevant issue in the Ray official GitHub repository: [Ray debugger] Unable to use debugger on Ray Cluster on k8s. From the discussion, it's clear that Ray's initial solution was to have Workers use a fixed port range when exposing ports for attachment, allowing users to pre-expose these ports externally for attachment:
Some developers even submitted related PRs attempting to integrate this functionality into the Ray kernel, but the PR was ultimately not progressed and was automatically closed:
I speculate that this approach did not progress primarily because of several obvious issues:
-
Port Range Setting Challenge: How to determine an appropriate port range? Too small a range might not cover all breakpoints, while too large a range might occupy too many cluster resources or even conflict with ports of system components like the Kubernetes API Server.
-
High Operational Complexity: Even with a defined port range, users would still need to manually expose numerous ports, a process that is cumbersome and error-prone, contradicting the automated design philosophy of cloud-native environments.
-
Network Connection Barriers: Most critically, even if ports are successfully exposed, the Ray Distributed Debugger VSCode plugin would still attempt to connect to IP addresses internal to the Kubernetes cluster, which are not reachable from outside. Since the VSCode plugin is now closed-source and managed by Anyscale, we cannot modify its connection logic.
In theory, one could set up kubectl port-forward for each breakpoint and combine it with iptables rules to redirect local requests to Kubernetes internal IPs to the corresponding local ports. However, this method is cumbersome, difficult to automate, requires deep networking knowledge, and is almost unmaintainable when dealing with numerous breakpoints.
Considering these factors, especially the fundamental limitation in point three, I abandoned this technical path and sought a simpler solution.
At the end of the aforementioned issue discussion, a user reported successfully solving the problem by deploying Code Server in their Kubernetes cluster:
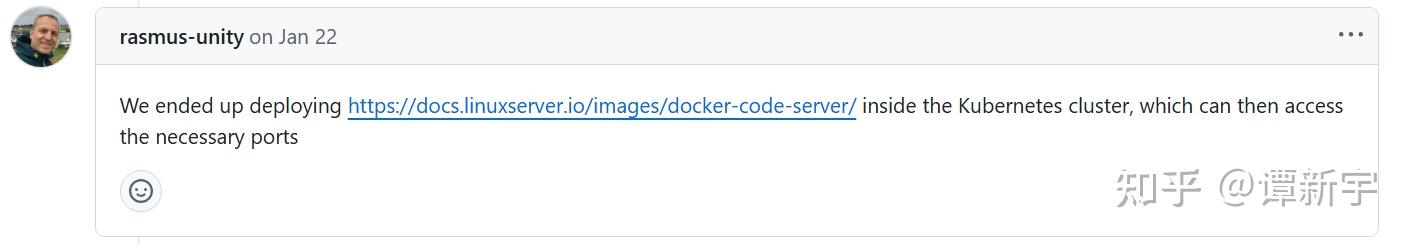
This approach was acknowledged by the Ray team, but due to the lack of specific implementation details and a complete solution, the approach remained at a conceptual stage:
Inspired by this, I decided to explore this approach. Code Server is a VSCode service that runs in a browser, providing an experience almost identical to the desktop VSCode:
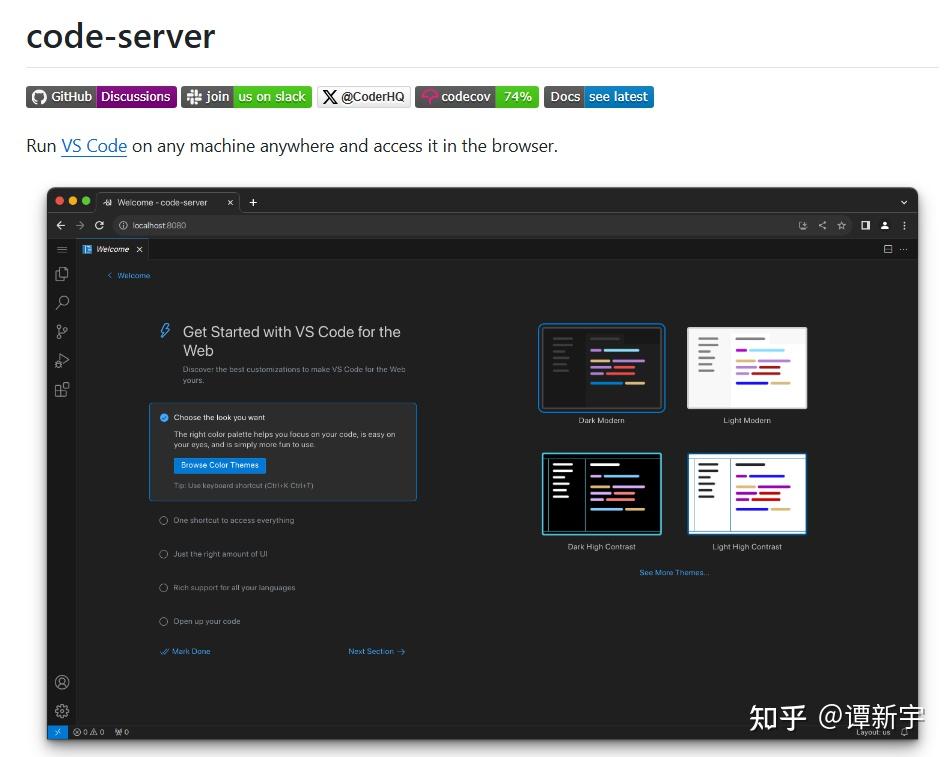
This feature provided a solution to the problem: if VSCode is deployed inside the Kubernetes cluster and accessed via a browser, it can bypass network isolation issues, allowing VSCode to directly access the Ray cluster's internal network. This approach does not require managing SSH keys or configuring complex VSCode Remote connections, making the process straightforward.
To optimize the experience and resolve potential conflicts between different RayJobs, I designed a solution to deploy Code Server as a Sidecar container for the Ray Head. This not only ensures that Code Server shares the lifecycle with the Ray cluster but also allows direct access to Ray's working directory, achieving seamless integration.
Based on this approach, I developed a specialized image and uploaded it to Dockerhub: onesizefitsquorum/code-server-with-ray-distributed-debugger. This image is based on linuxserver/code-server:4.101.2 and comes pre-installed with Python, Ray, debugpy, and other necessary dependencies, as well as VSCode's Python Run/Debug and Ray Distributed Debugger plugins.
Here is the core Dockerfile for the image:
FROM linuxserver/code-server:4.101.2

RUN sudo apt-get update && apt-get install -y software-properties-common && sudo add-apt-repository ppa:deadsnakes/ppa && apt-get install -y python3 python3-pip && pip3 install ray[default] debugpy --break-system-packages

RUN mkdir -p /config/extensions \
    && curl -L -o /config/extensions/ms-python.python.vsix https://marketplace.visualstudio.com/_apis/public/gallery/publishers/ms-python/vsextensions/python/2025.10.0/vspackage \
    && curl -L -o /config/extensions/ms-python.debugpy.vsix https://marketplace.visualstudio.com/_apis/public/gallery/publishers/ms-python/vsextensions/debugpy/2025.10.0/vspackage \
    && curl -L -o /config/extensions/anyscalecompute.ray-distributed-debugger.vsix https://marketplace.visualstudio.com/_apis/public/gallery/publishers/anyscalecompute/vsextensions/ray-distributed-debugger/0.1.4/vspackage \
    && /app/code-server/bin/code-server --extensions-dir /config/extensions --install-extension ms-python.python \
    && /app/code-server/bin/code-server --extensions-dir /config/extensions --install-extension ms-python.debugpy \
    && /app/code-server/bin/code-server --extensions-dir /config/extensions --install-extension anyscalecompute.ray-distributed-debugger
Next, configure Code Server as a Sidecar container for the Pod hosting the Ray Head, ensuring it shares the working directory with Ray. Note that Code Server needs to use the custom image uploaded to DockerHub earlier. Key Kubernetes configuration snippets are as follows:
containers:
- image: rayproject/ray:2.46.0
  name: ray-head
  ports:
  - containerPort: 6379
    name: gcs-server
  - containerPort: 8265
    name: dashboard
  - containerPort: 10001
    name: client
  resources:
    limits:
      cpu: "500m"
    requests:
      cpu: "200m"
  volumeMounts:
    - mountPath: /tmp/ray
      name: shared-ray-volume
- name: vscode-debugger
  image: docker.io/onesizefitsquorum/code-server-with-ray-distributed-debugger:4.101.2
  imagePullPolicy: IfNotPresent
  ports:
    - containerPort: 8443
  volumeMounts:
    - mountPath: /tmp/ray
      name: shared-ray-volume
  env:
    - name: PUID
      value: "1000"
    - name: PGID
      value: "1000"
    - name: TZ
      value: "Asia/Shanghai"
    - name: DEFAULT_WORKSPACE
      value: "/tmp/ray/session_latest/runtime_resources"
    - name: SUDO_PASSWORD
      value: "root"
volumes:
- name: shared-ray-volume  # Shared volume for /tmp/ray
emptyDir: {} Through the technical exploration above, we've successfully made Ray Distributed Debugger usable in the Kuberay environment. Below is a complete example of using Ray Distributed Debugger in a Kuberay cluster with the work from this article. All related code and configuration files have been uploaded to the GitHub repository for reference and use.
For developers with specific business requirements, you only need to understand the core logic of the example code to easily extend and implement custom Debugger management functions without redeveloping basic components and images.
When performing development and debugging, you can choose between local environments or cloud development environments. For cloud development, GitHub Codespaces provides a convenient option:
- Each GitHub account has 60 hours of free usage per month
- The free tier provides a Linux environment with 2 CPU cores, 4GB RAM, and 32GB storage
- It comes pre-installed with Docker, Kubernetes toolchain, and other essential development tools
- You can develop directly in your browser without local environment configuration
These resources are sufficient for running the example code in this article and small Kubernetes clusters (like kind, k3d, etc.), making it ideal for learning and testing Ray's debugging capabilities.
The specific steps are as follows:
-
Ensure that Kubernetes, Kuberay Operator, and the Kubectl ray plugin are installed. If using GitHub Codespaces, you can install these tools directly in the terminal.
-
Enter the example directory and execute the following command to start a cluster containing Ray Head, Code Server, and Ray Worker:
kubectl ray job submit -f ray-job.interactive-mode.yaml --working-dir ./working_dir --runtime-env-json="{\"pip\": [\"debugpy\"], \"py_modules\": [\"./dependency\"]}" -- python sample_code.py-
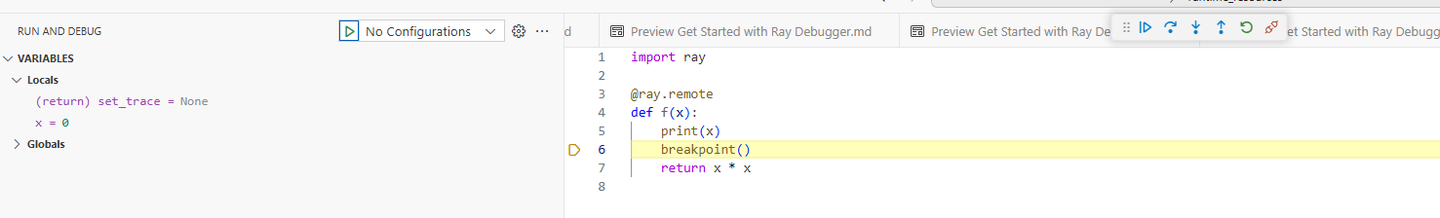
After the cluster starts, it will automatically install debugpy and transfer the working directory and module files to the Ray Cluster. When the code execution reaches the
breakpoint()statement, it will wait for the debugger to attach. -
Use the following command to forward the Code Server port:
kubectl port-forward pod/the-name-of-ray-head 8443:8443-
Open a browser and visit
http://127.0.0.1:8443to enter the Code Server interface. If running in GitHub Codespaces, you can leverage its port forwarding functionality, which automatically creates accessible URLs. -
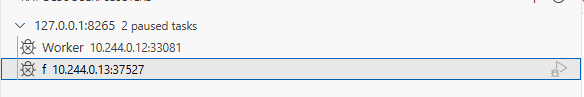
In Code Server, use the Ray Distributed Debugger plugin to connect to
127.0.0.1:8265(the Ray Head's Dashboard address) to see and connect to all breakpoints.
The interface after successful deployment looks like this:
Through this exploration, we found a method to use Ray Distributed Debugger in the Kuberay environment. This solution uses Code Server as an intermediate layer to solve connection problems caused by Kubernetes network isolation. The main takeaways are as follows:
-
Solved a Practical Problem: Successfully resolved the connection barrier caused by Kubernetes network isolation mechanism for Ray Distributed Debugger by using Code Server as a bridge.
-
Provided a Practical Solution: The solution includes complete image building, configuration templates, and usage guides that can be directly applied to actual development environments.
-
Simplified Operation Process: Adopted the Sidecar container mode to ensure shared lifecycle with the Ray cluster, and achieved seamless resource access through shared volumes.
-
Inspired Thinking: This solution is not only applicable to Ray Distributed Debugger but may also be suitable for other development and debugging scenarios in Kubernetes environments.
From a broader perspective, this attempt also triggered some reflections:
-
Development Experience in Cloud-Native Environments: As cloud-native technologies become more widespread, how to provide a good development experience while maintaining isolation is a worthy issue to consider. Both the Code Server mentioned in this article and cloud development environments like GitHub Codespaces are evolving toward simplifying the developer experience.
-
Prospects for Browser-Based IDEs: Browser-based VSCode allows developers to obtain a consistent development experience on different devices, and this mode has great potential in cloud development environments. Both Code Server and Codespaces adopt this model, lowering the barrier to environment configuration.
-
Value of Open Source Community Collaboration: The solution to this problem originated from community discussions and will be fed back to the community, embodying the value of open source collaboration.
I plan to share this solution with the Ray community, hoping to help developers with similar needs. At the same time, community members are welcome to improve and refine the solution.