Assessment of ENSO and other variability in 104 #8

Replies: 39 comments 45 replies

-
|
The easiest thing to do first is for me to add a ridiculous screenshot that @megandevlan and I looked at for the evolution of ENSO between 98 and 109. Bottom line it's complicated and data insufficient, but promising! |

Beta Was this translation helpful? Give feedback.

-
|
But this is the 104 20th C and obe for the same period - pretty good. |


Beta Was this translation helpful? Give feedback.

-
|
Another metric, this is looking at the correlation of SST anomalies and the Nino 3.4 index within the Nino 3.4 box at various lag//lead times. It looks like 104 B1850 (peach dashed line) and the historical run (red dashed line) are two of the better performing simulations. Still showing somewhat of a too-regular ENSO pattern with elevated correlations well ahead of and after ENSO events, but certainly an improvement on other simulations.
|

Beta Was this translation helpful? Give feedback.

-
|
Looking at 104 in the CVDP, there were a couple metrics that gave me pause. First, the standard deviation of SST in the Tropical Pacific for DJF:
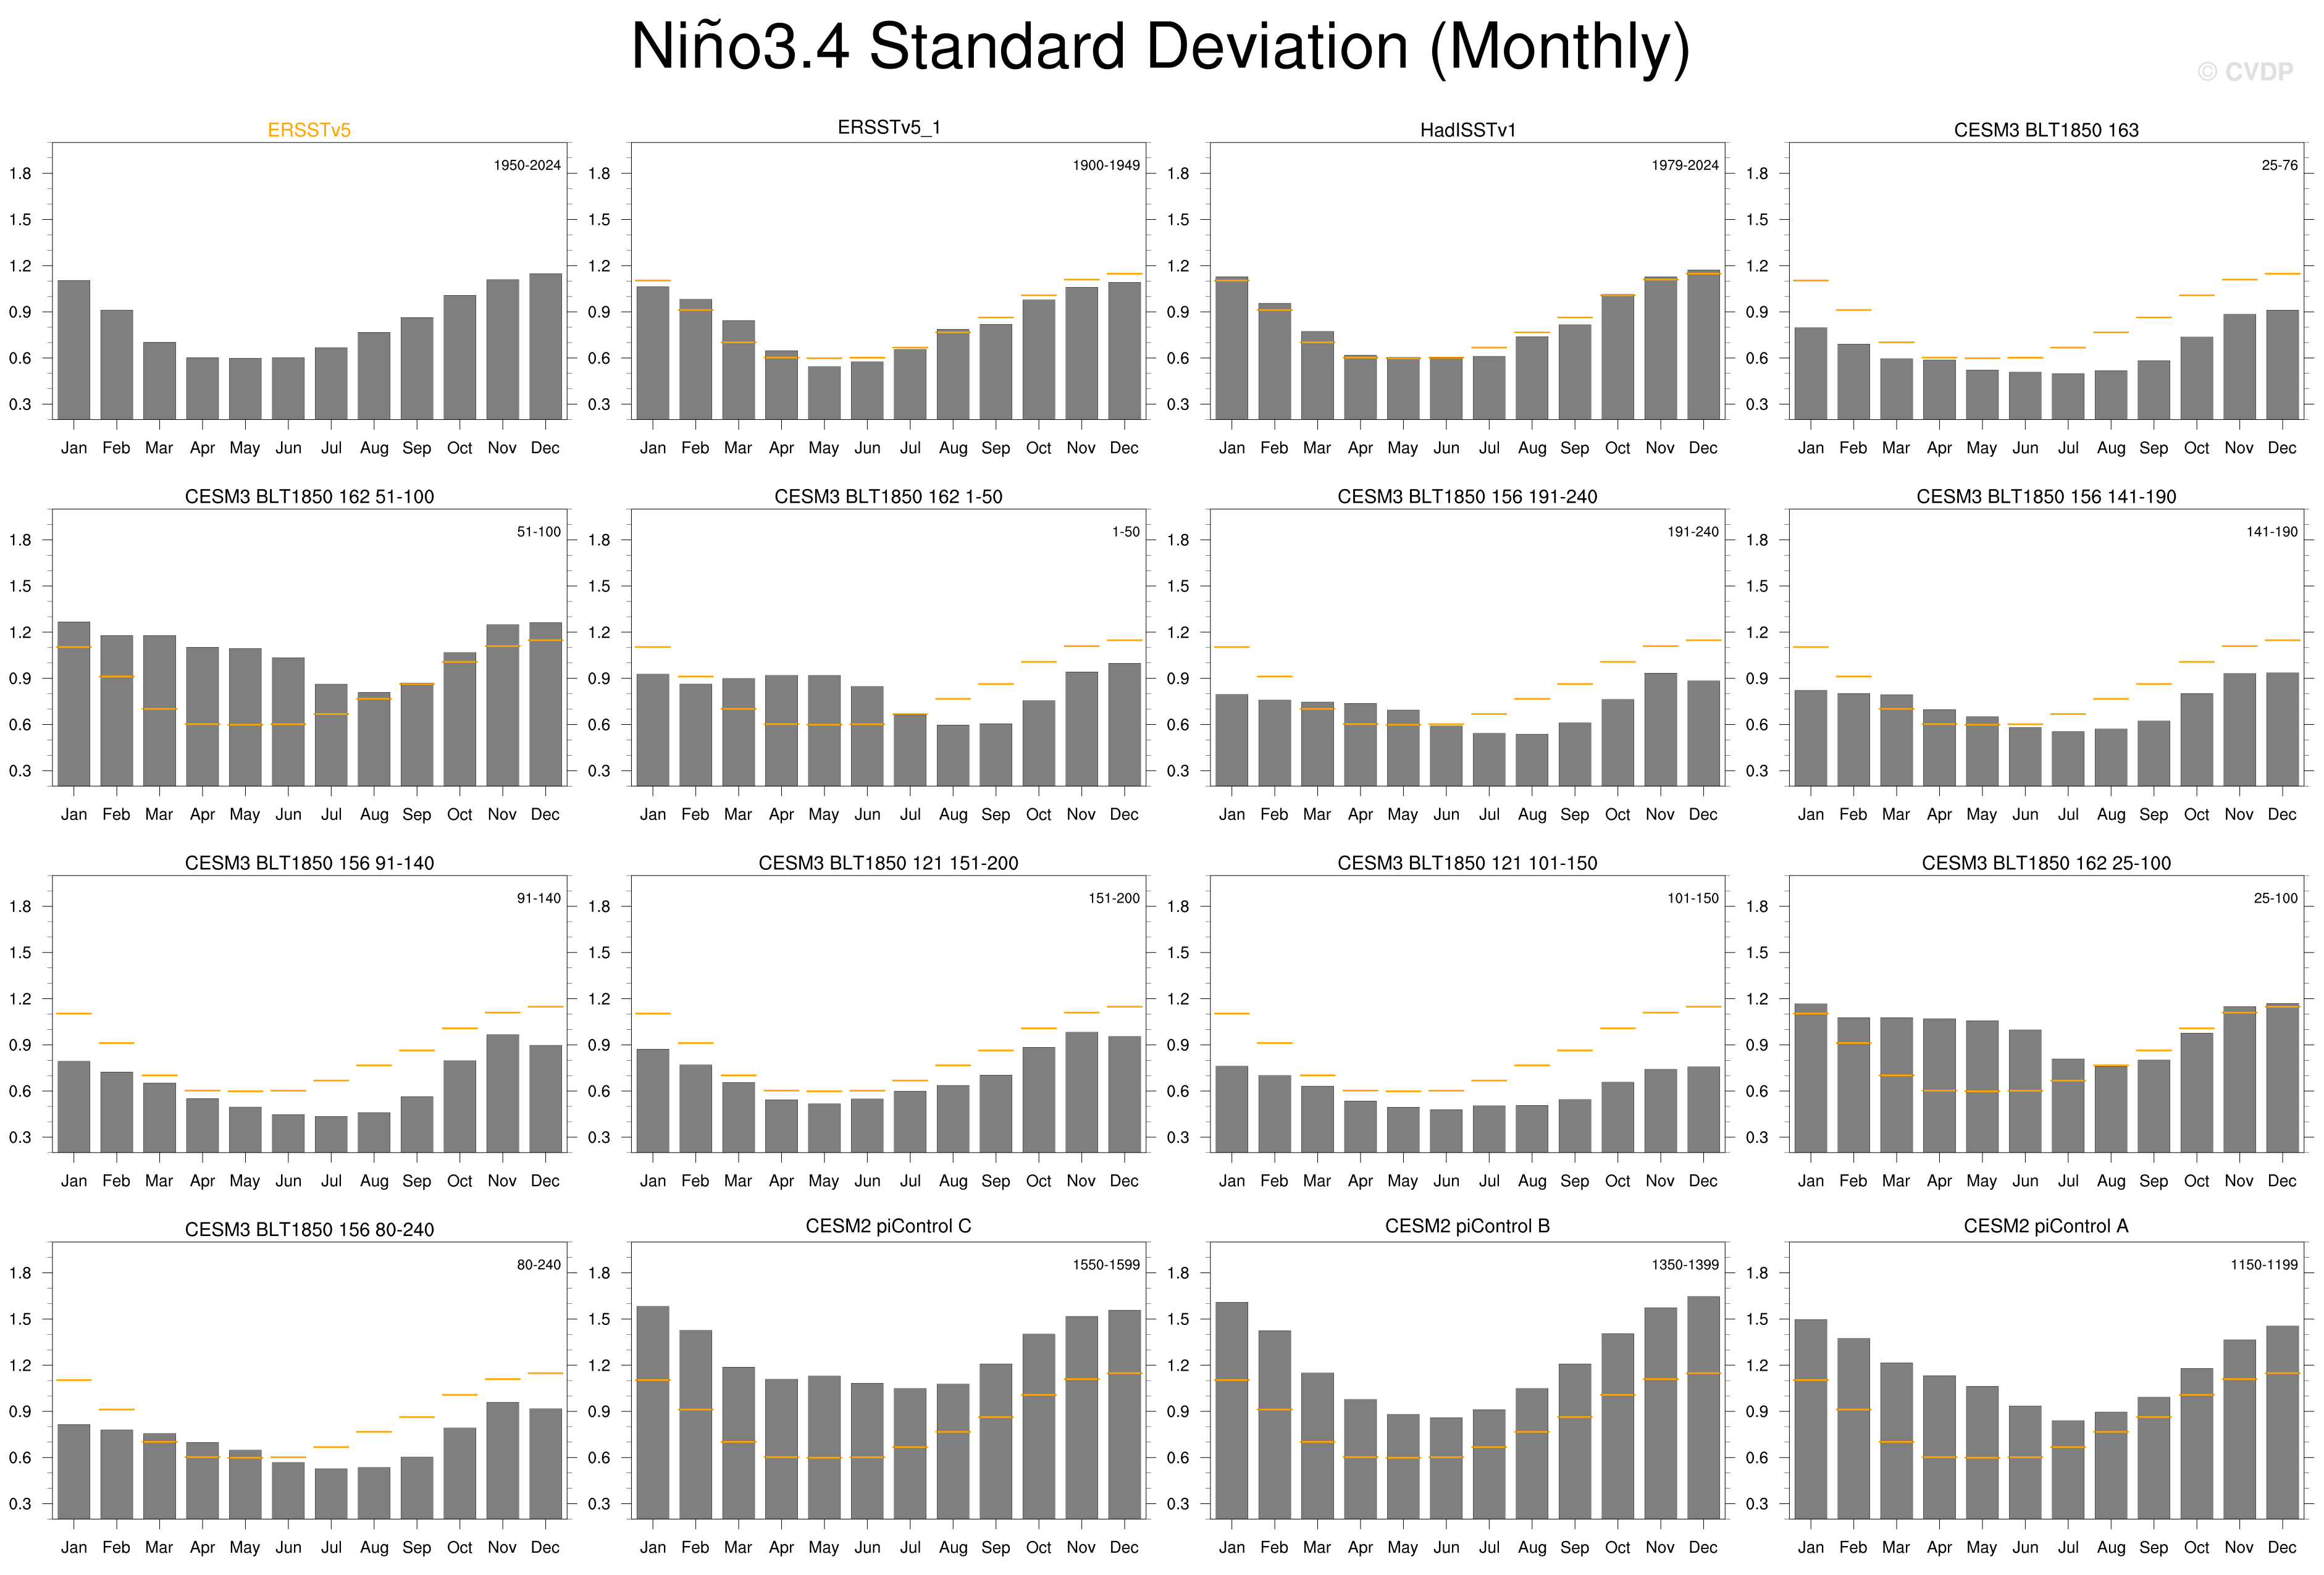
compared to that seen in 99 and obs: I haven't seen such limited variability in the tropical Pacific SSTs in any prior CESM3 run. Here is a histogram of the nino3.4 standard deviations by month for 104LT/MT (observational estimates = orange lines):
compared to those from 92/98/99 (and earlier CESM3 runs):
|


Beta Was this translation helpful? Give feedback.

-
|
I'm trying to reconcile this standard deviation plot with Rich's. Rich's is variance and this is standard deviation but it seems they are different. A standard deviation of 0.7 in January for the new runs in these plots would give a variance of 0.7 times 0.7 which is something more like 0.5 whereas RIch's variance plots are showing something more like 0.8. Maybe these are plotting different things aside from that? |
Beta Was this translation helpful? Give feedback.

-
|
Two thoughts: Rich's is from the 104 historical, mine is from the piControl. And mine has been quadratically detrended prior to the calculation. There is a positive trend of .5->1C across the nino3.4 region in 104LT over the period I am looking at. |
Beta Was this translation helpful? Give feedback.
-
|
A few things. Mine is just a linear de-trend, but unlikely to be the difference think. Also Adam is using 1979-2023 for the monthly std plots, when there is significant more variability than earlier in the century (granted that is pre-satellite) whereas I am using the whole period for the 104 HIST comparison. And yes there is no doubt the HIST simulations look more active than the 1850 for #104. |
Beta Was this translation helpful? Give feedback.

-
|
I also have concerns about the CESM3 simulated patterns of ENSO teleconnections and attach a related figure below. The top two panels are CESM3 (98b). The mid left is GPCP, right is CESM2. The bottom ones are CESM3 biases versus each. Note the weakness of the NH ITCZ bias in the eastern Pacific and the strength in the SH. I see the same issue for radiative flues and across all members of CESM3. I suspect the issue is related to the equatorial dry zone bias.
|

Beta Was this translation helpful? Give feedback.
-
|
The nino3.4 autocorrelation looks better w/112 (upper right panel) compared to the 104 variants (2nd row), and looks more similar to the CESM2-piControl (bottom 2 rows):
The Tropical Pacific variability looks better in 112 as well:
The ENSO teleconnections are also slightly improved, and the Tropical Pacific dry slot has also improved slightly. Good news! |


Beta Was this translation helpful? Give feedback.

-
|
Unfortunately I'm not seeing a big improvement in ENSO teleconnections in 112 (top right) - and still much lower than CESM2 (mid right). There is some noise in this metric, so its hard to be definitive, but the overall score I find of 0.78 (not shown) is still much less than CESM2 (0.84) for which the 2 sigma range is 0.02 based on CESM1-LE. See also the poor Z500* teleconnections attached. |


Beta Was this translation helpful? Give feedback.

-
|
It looks like the western extent of SST anomalies has grown in 112 as well (at least for the highest autocorrelation region): The minimum variance of the monthly Nino3.4 index has increased a bit, but the maximum is still pretty low: |


Beta Was this translation helpful? Give feedback.
-
|
It looks like part of the discrepancy is the period looked at. I'm using years 1-90 and the Nino 3.4 autocorrelation looks fairly problematic: But if I use years 6-50 as in @phillips-ad nice postage-stamp plot above, things aren't nearly as concerning. |


Beta Was this translation helpful? Give feedback.
-
|
Great point - for all metrics it helps to provide some range of uncertainty against the CESM2 LE when possible. ENSO in particular has considerable internal noise. |
Beta Was this translation helpful? Give feedback.
-
|
Man, adding another 46 years to 112 definitely changed things. (Good catch on my analyzation years @megandevlan!) So I just extended my 112 data through year 96, and ran a CVDP comparison where I specified the last 80 years of 112 as the reference, 77 80-year slices of the CESM2 piControl, and 8 overlapping 80 year slices from observations. The nino3.4 autocorrelation is as previously showed of course, but I'm adding this as it shows the spread in CESM2 (top panel) and observations (bottom panel):
112 isn't really oscillating and is well outside the observational spread. The ENSO spatial composites show very little response in the North Pacific with little deepening of the Aleutian Low (upper left plot is 112, the other 3 panels are random CESM2 slices): That phenomenon may be linked to a weaker precipitation response. Here are difference plots for the ENSO precipitation spatial composite between 112 and CESM2 (top) and observations over land (bottom). Looking at the top plot, CESM2 is much wetter (drier) in the Central Tropical Pacific (Western Tropical Pacific). |


Beta Was this translation helpful? Give feedback.
-
|
I agree with @phillips-ad here definitely. CESM2 had about the right remote response with too strong nino3.4 SSTA amplitudes. CESM3 seems to have a better SSTA amplitude but with much weaker teleconnections. We need to look at the precip response more closely I imagine. |
Beta Was this translation helpful? Give feedback.

-
|
Given that in the past we had seen issues with the upper tropospheric westerlies in the Pacific sector, I had been meaning to check what that's currently looking like since it could impact ENSO teleconnections. Happy to report it looks good! No problems there.
|

Beta Was this translation helpful? Give feedback.
-
|
FWIW, CMATv1 scores continue to be modest and certainly less than CESM2 for recent CESM3 members. Versions in the teens score notably worse. 121 seeks OK and within the uncertainty of internal variability from the best scores in earlier versions. |

Beta Was this translation helpful? Give feedback.
-
|
CMATv1 scores continue to be modest and certainly less than CESM2 for recent CESM3 members. |
Beta Was this translation helpful? Give feedback.
-
|
Not sure if we're adding things here, but he is a quick look at the Winter Eastward and Summer Northward (Bay of Bengal) propagating. Looks pretty good and not a lot of sensitivity in previous runs. I might go for 115 or 121 as the best, but hard to call. And all are competitive with CESM2 (caveat first ens. member 1979-2005). |


Beta Was this translation helpful? Give feedback.
-
|
SST anomaly variance in the Nino 3.4 region is more reasonable in 121; the monthly max is still a little low, but better than 116/118. But the period of ENSO looks to be really long in 121. |


Beta Was this translation helpful? Give feedback.

-
|
These are good and are the kinds of things we would like to review at the
next CESM Project Meeting.
…On Thu, Jan 9, 2025 at 9:24 AM Meg Fowler ***@***.***> wrote:
SST anomaly variance in the Nino 3.4 region is more reasonable in 121; the
monthly max is still a little low, but better than 116/118.
image.png (view on web)
<https://github.com/user-attachments/assets/4d733578-8399-4585-8b3e-d47454847517>
But the period of ENSO looks to be *really* long in 121.
Screenshot.2025-01-09.at.9.24.21.AM.png (view on web)
<https://github.com/user-attachments/assets/5dd19943-4589-4201-9de7-d928fac69fef>
—
Reply to this email directly, view it on GitHub
<#8 (comment)>,
or unsubscribe
<https://github.com/notifications/unsubscribe-auth/AFABYVEZUCIVEHWMF2U7MI32J2PFTAVCNFSM6AAAAABNYVKCE2VHI2DSMVQWIX3LMV43URDJONRXK43TNFXW4Q3PNVWWK3TUHMYTCNZYHA3DMOI>
.
You are receiving this because you are subscribed to this thread.Message
ID: ***@***.***>
|
Beta Was this translation helpful? Give feedback.
-
|
Adam has the CVDP diagnostics here too: https://webext.cgd.ucar.edu/BLT1850/b.e30_beta04.BLT1850.ne30_t232_wgx3.121/cvdp/. I don't have any more to say about these at this point, beyond what Meg's already said above. ENSO variance is improved, there may be too much in the spring but time will tell, and period seems long. |
Beta Was this translation helpful? Give feedback.
-
|
Update using years 60-156 in run 121 - the period of ENSO is a bit better than for the initial 100 years, but it's still pretty long: For context, I've plotted the number of months until the transition point on that red/blue autocorrelation plot. Run 121 is a bit high, but not too crazy relative to the rest of the development cycle. |


Beta Was this translation helpful? Give feedback.
-
Beta Was this translation helpful? Give feedback.
-
|
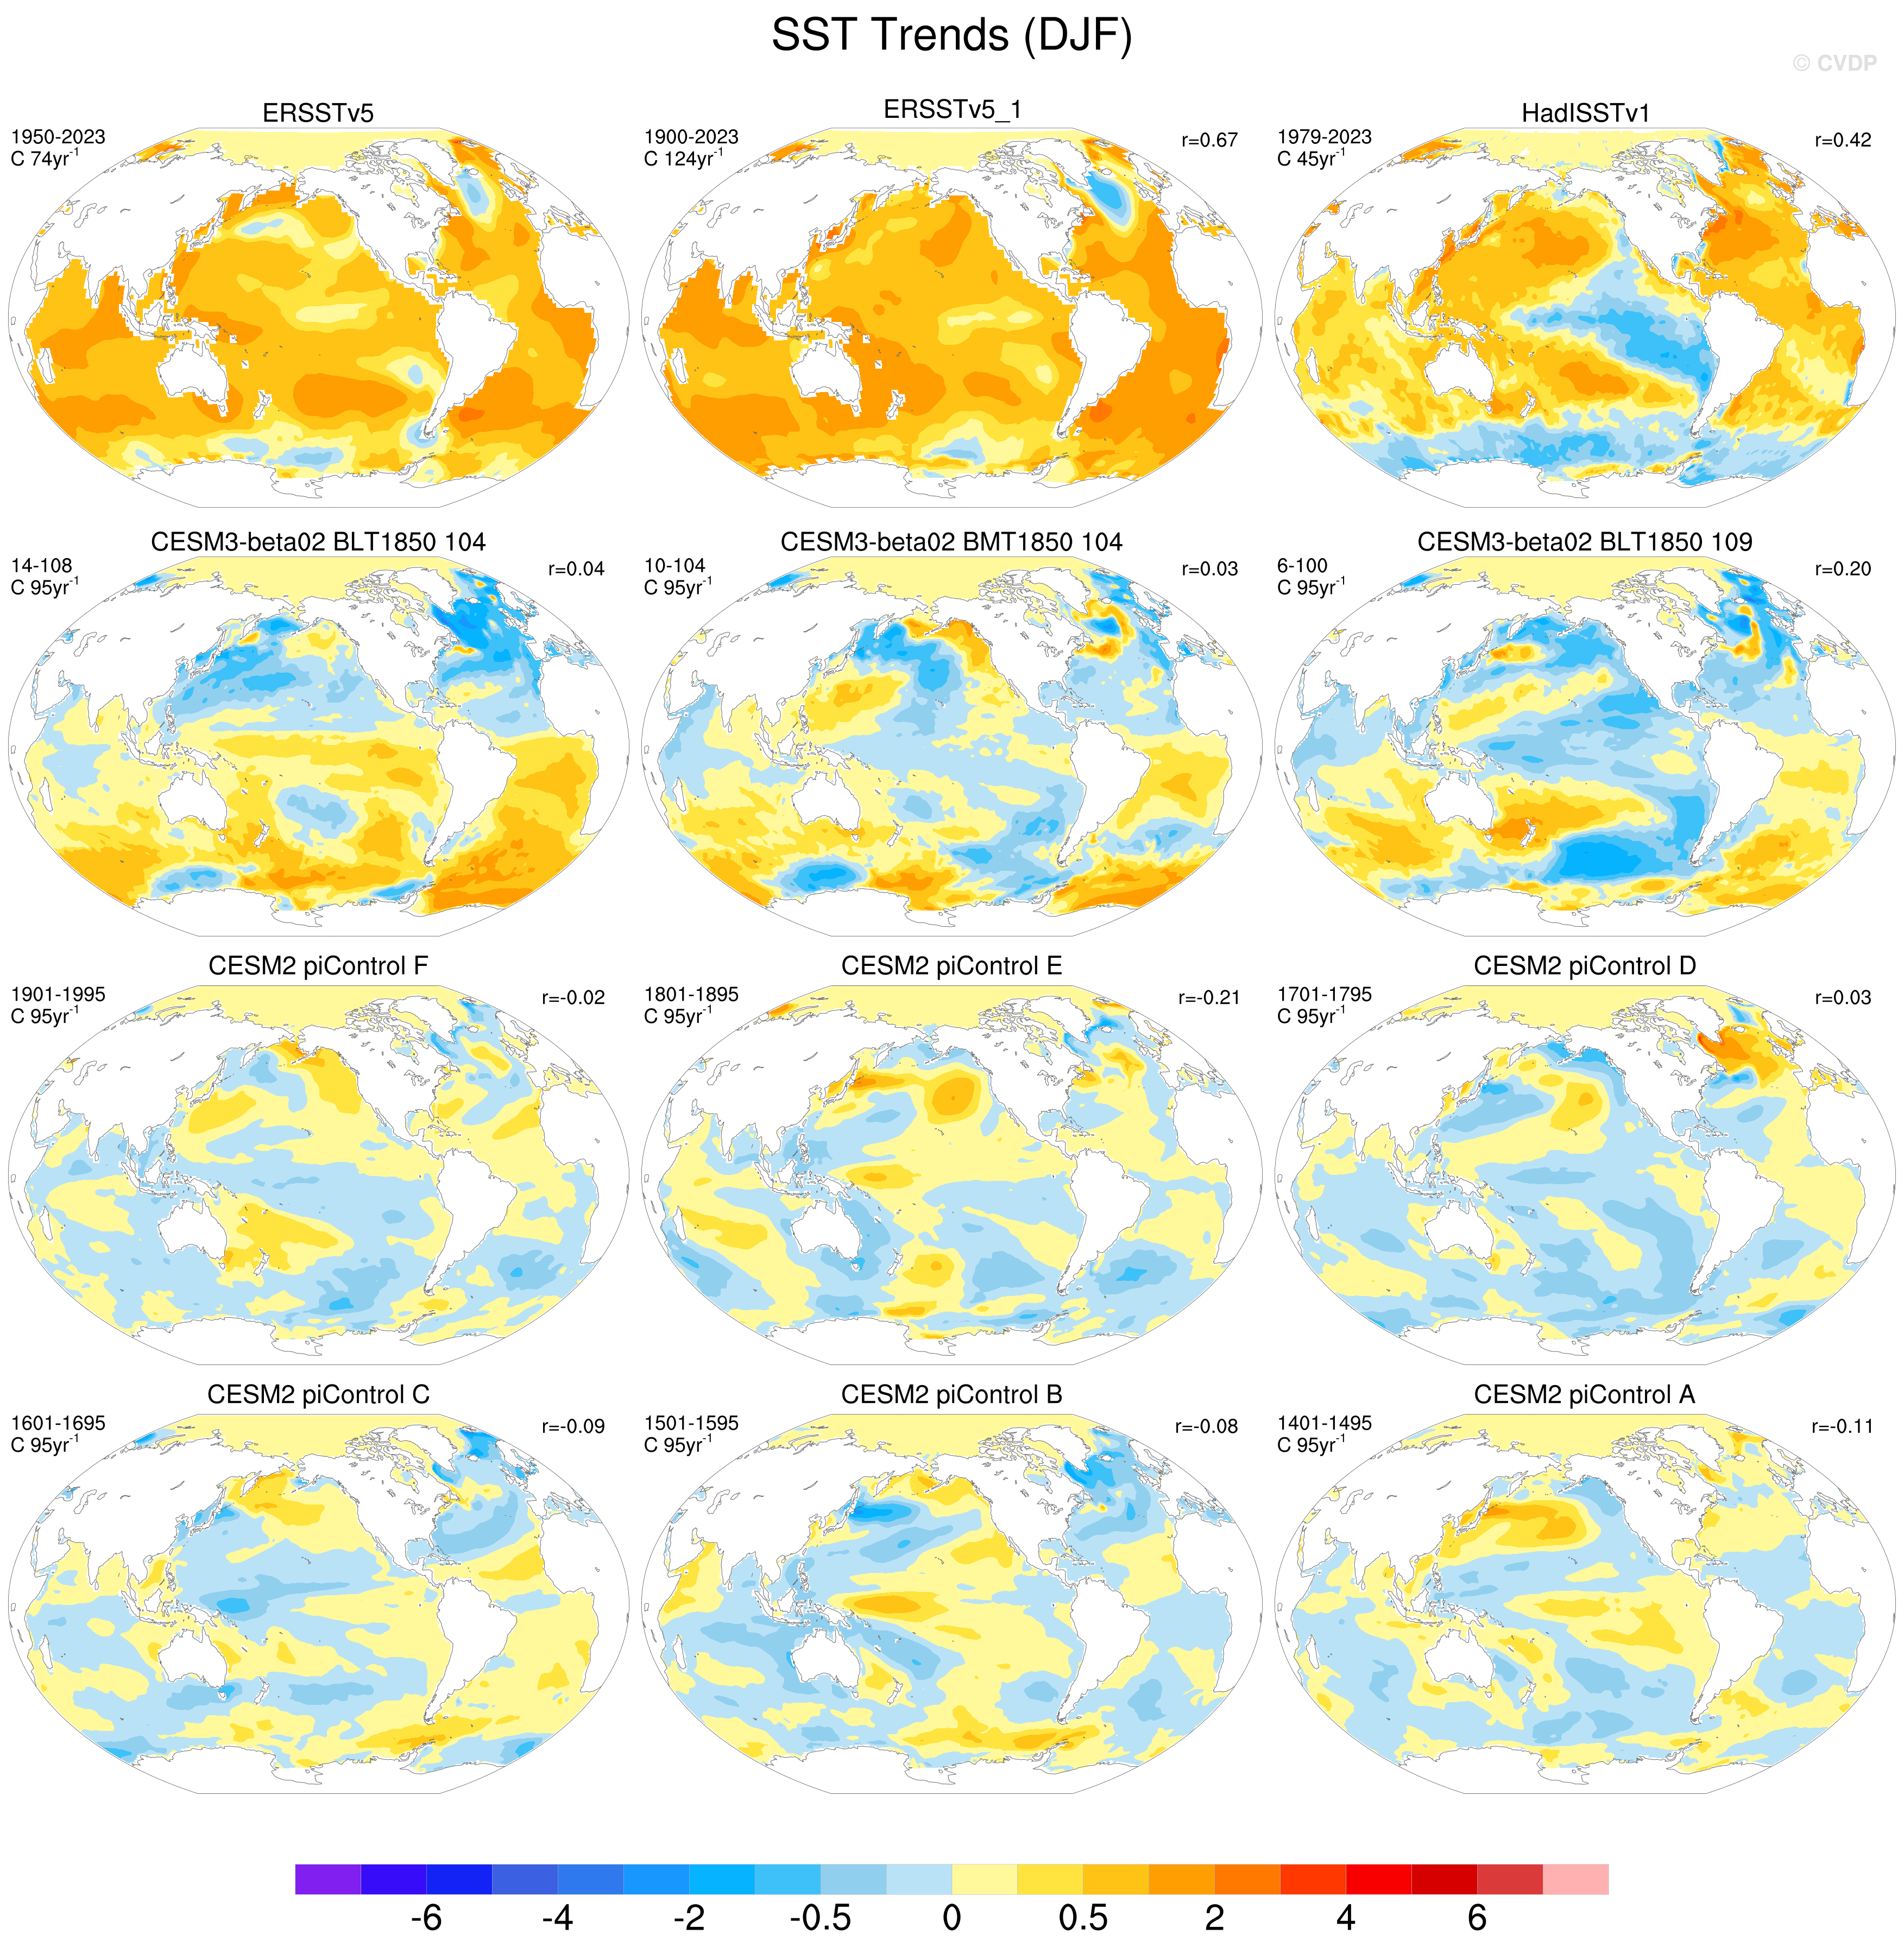
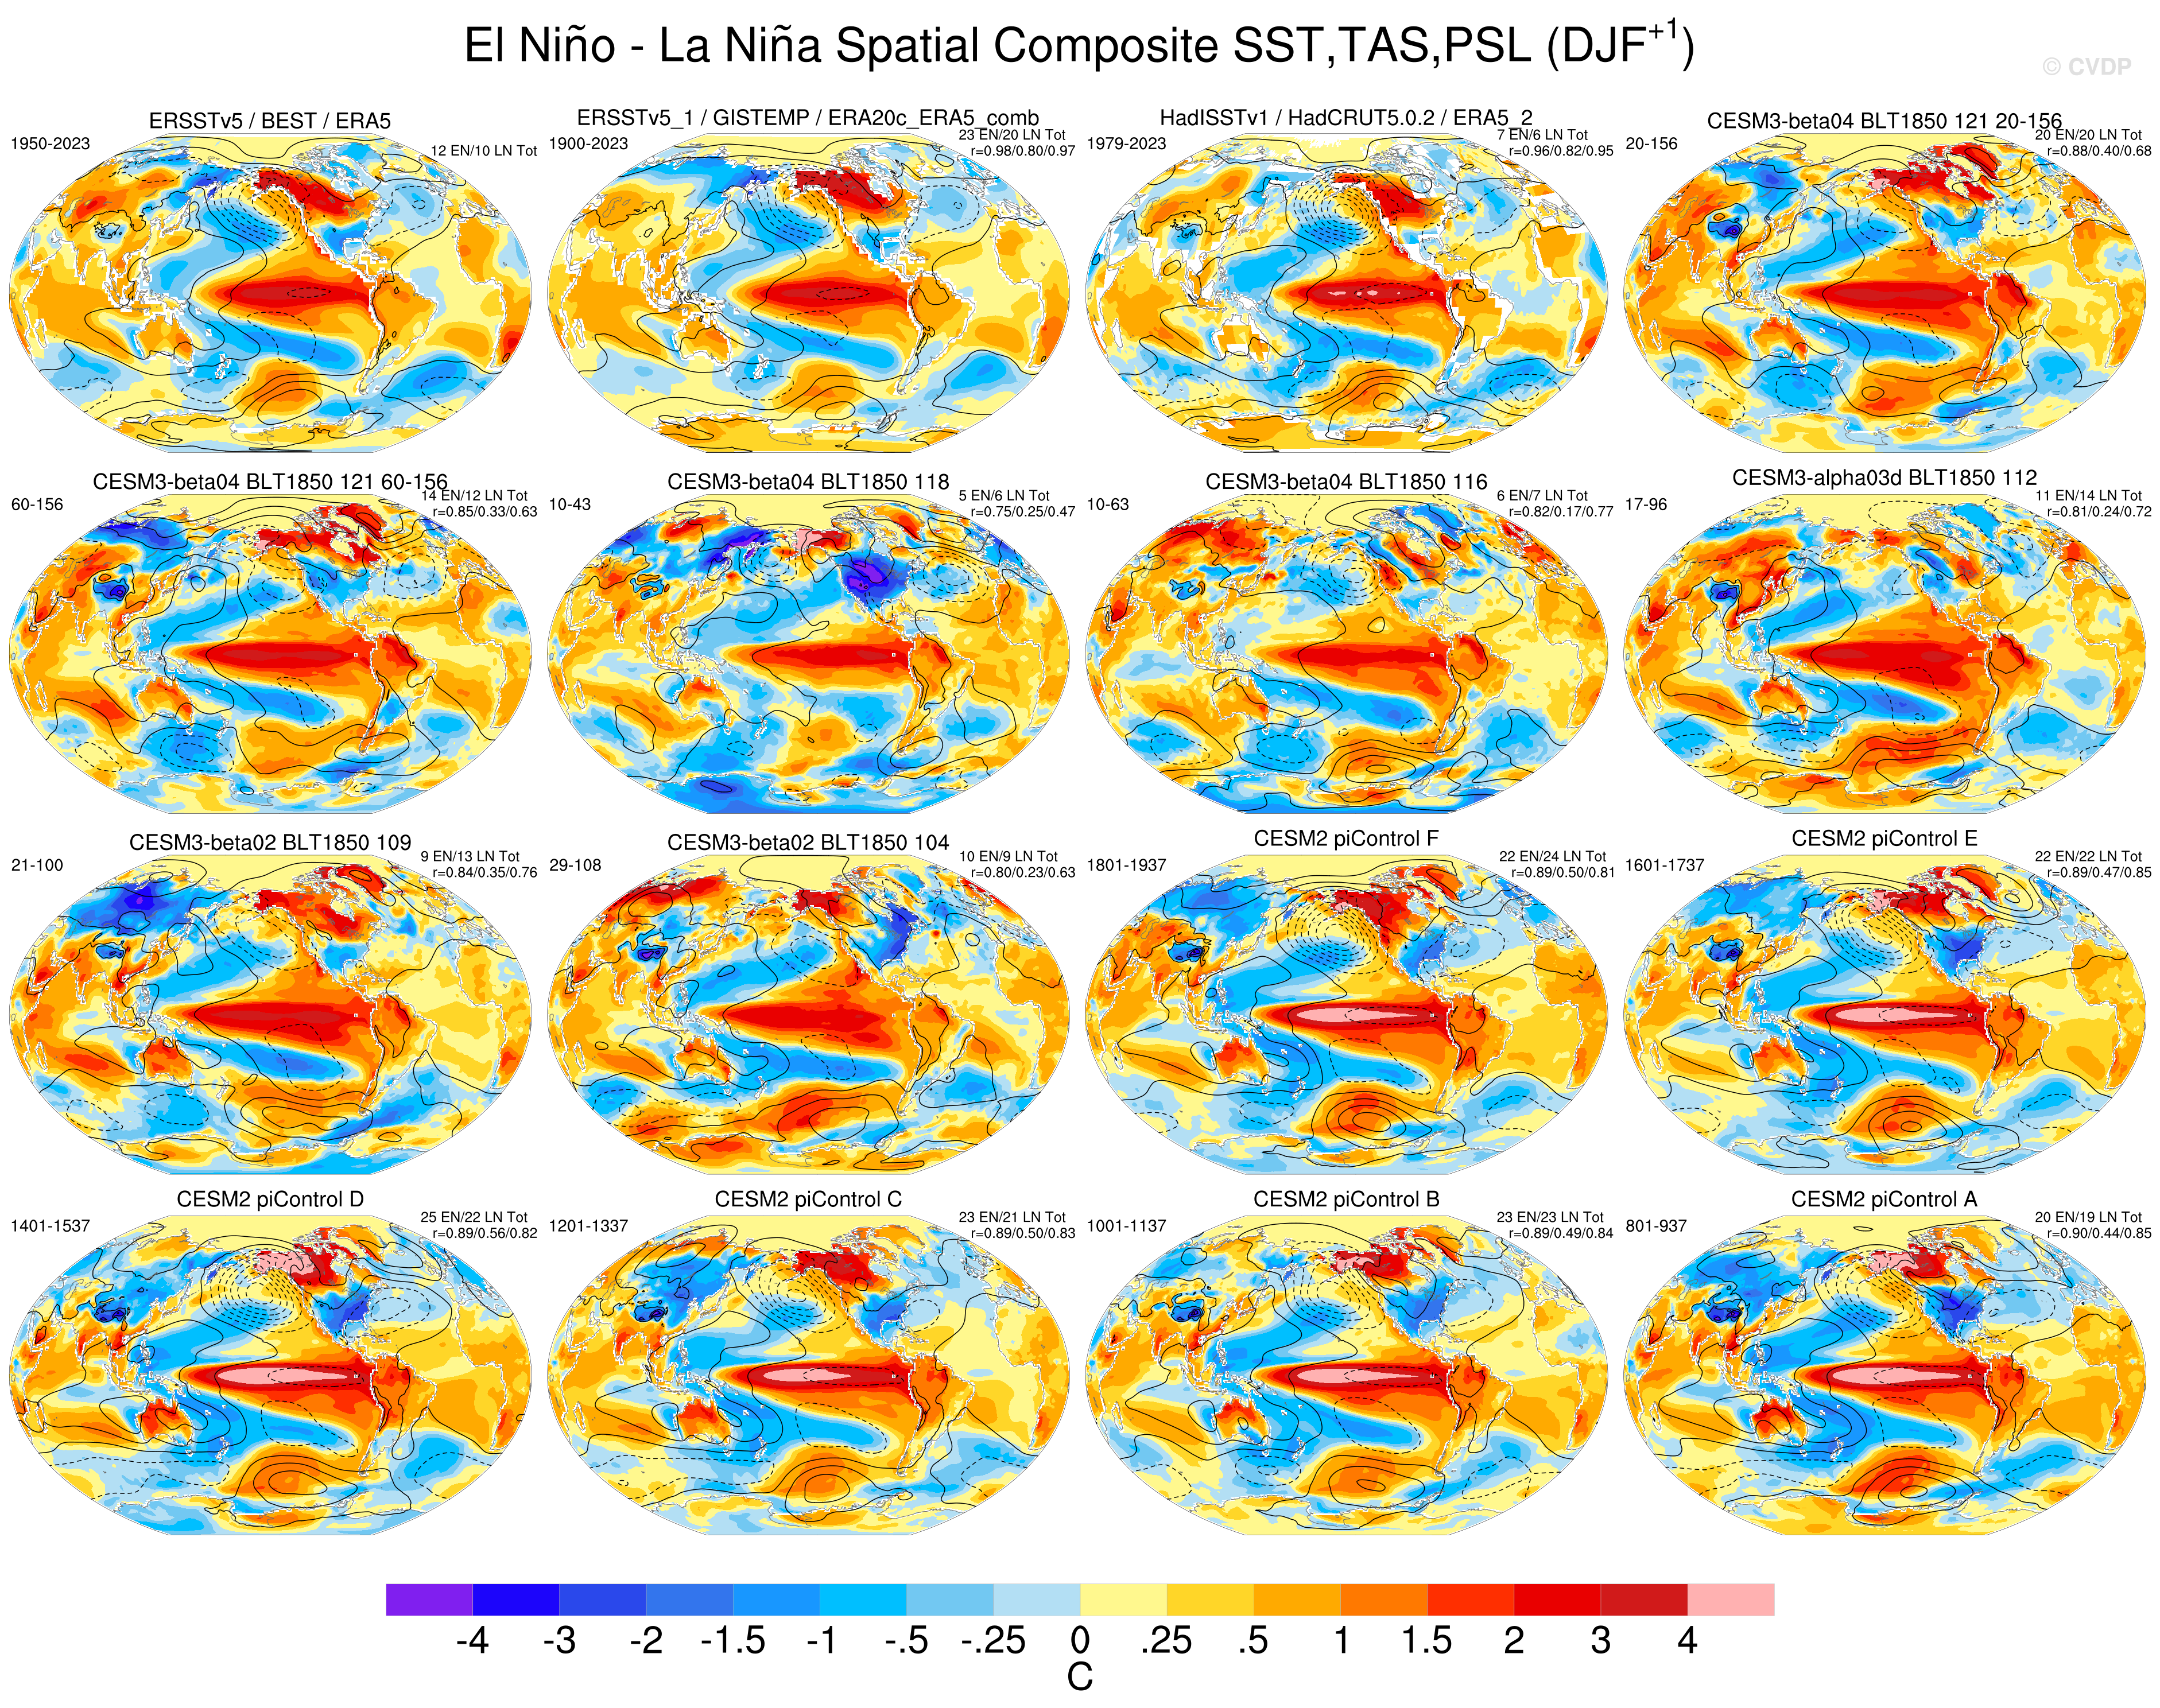
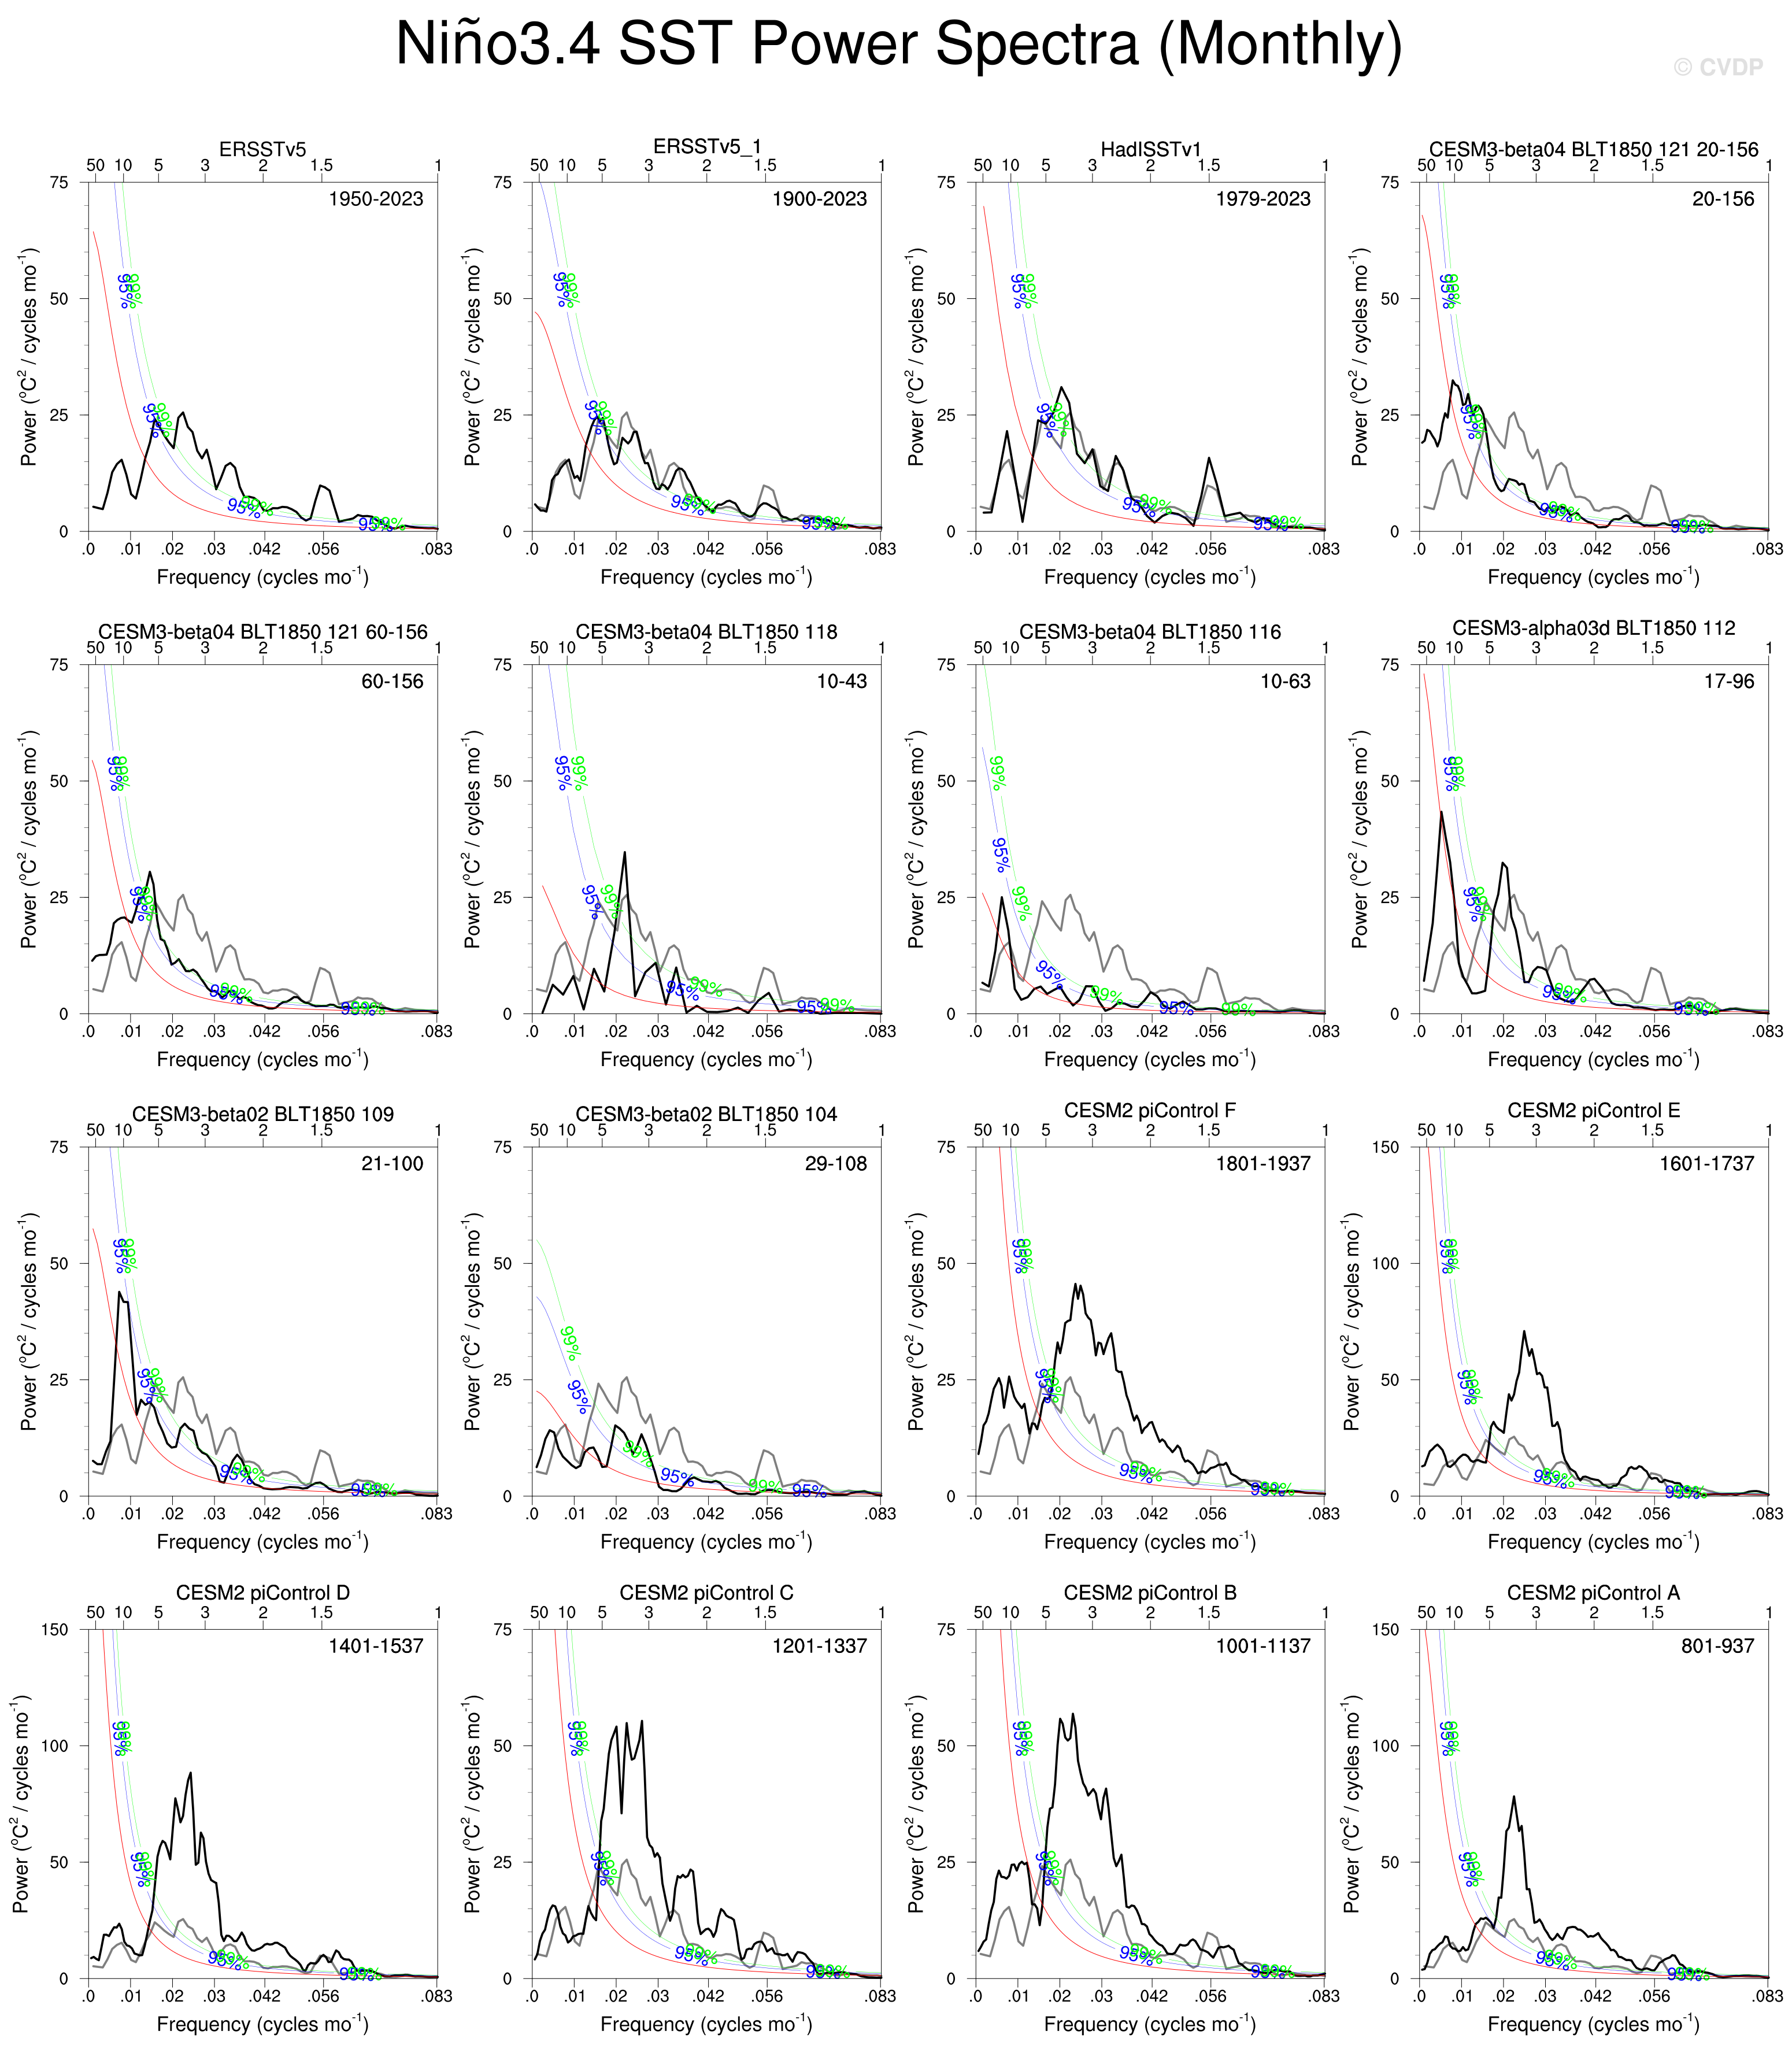
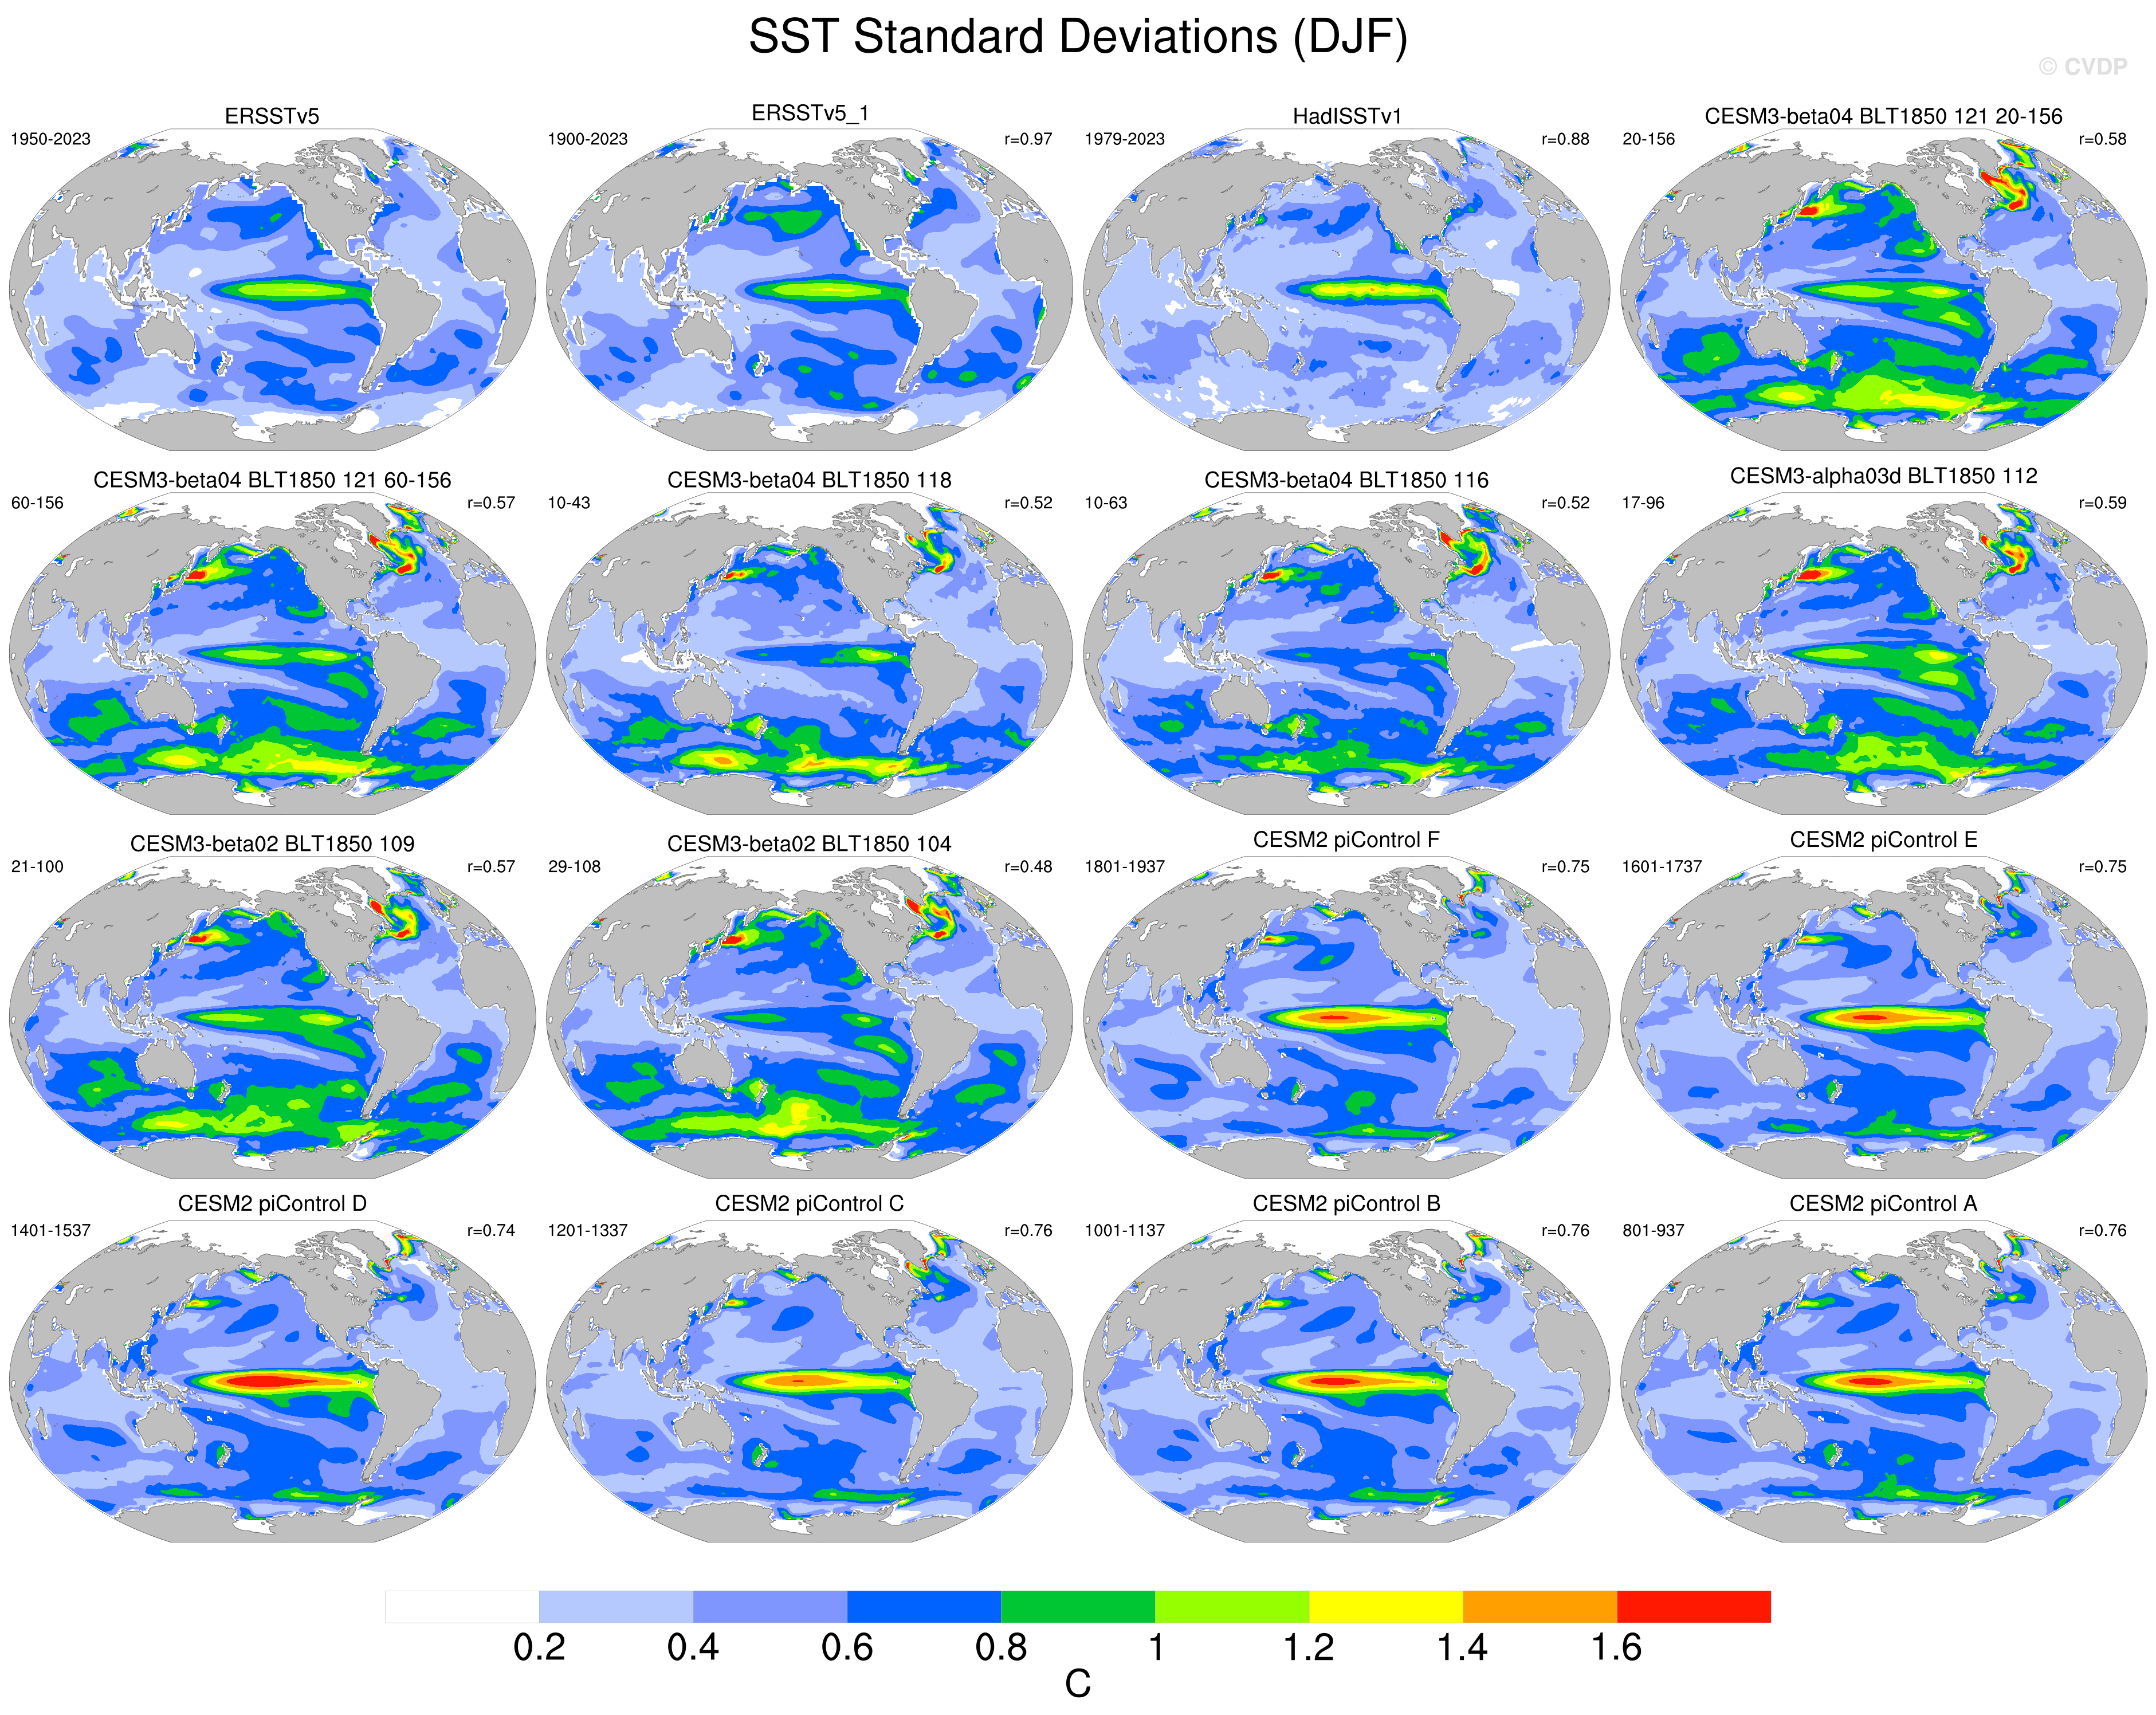
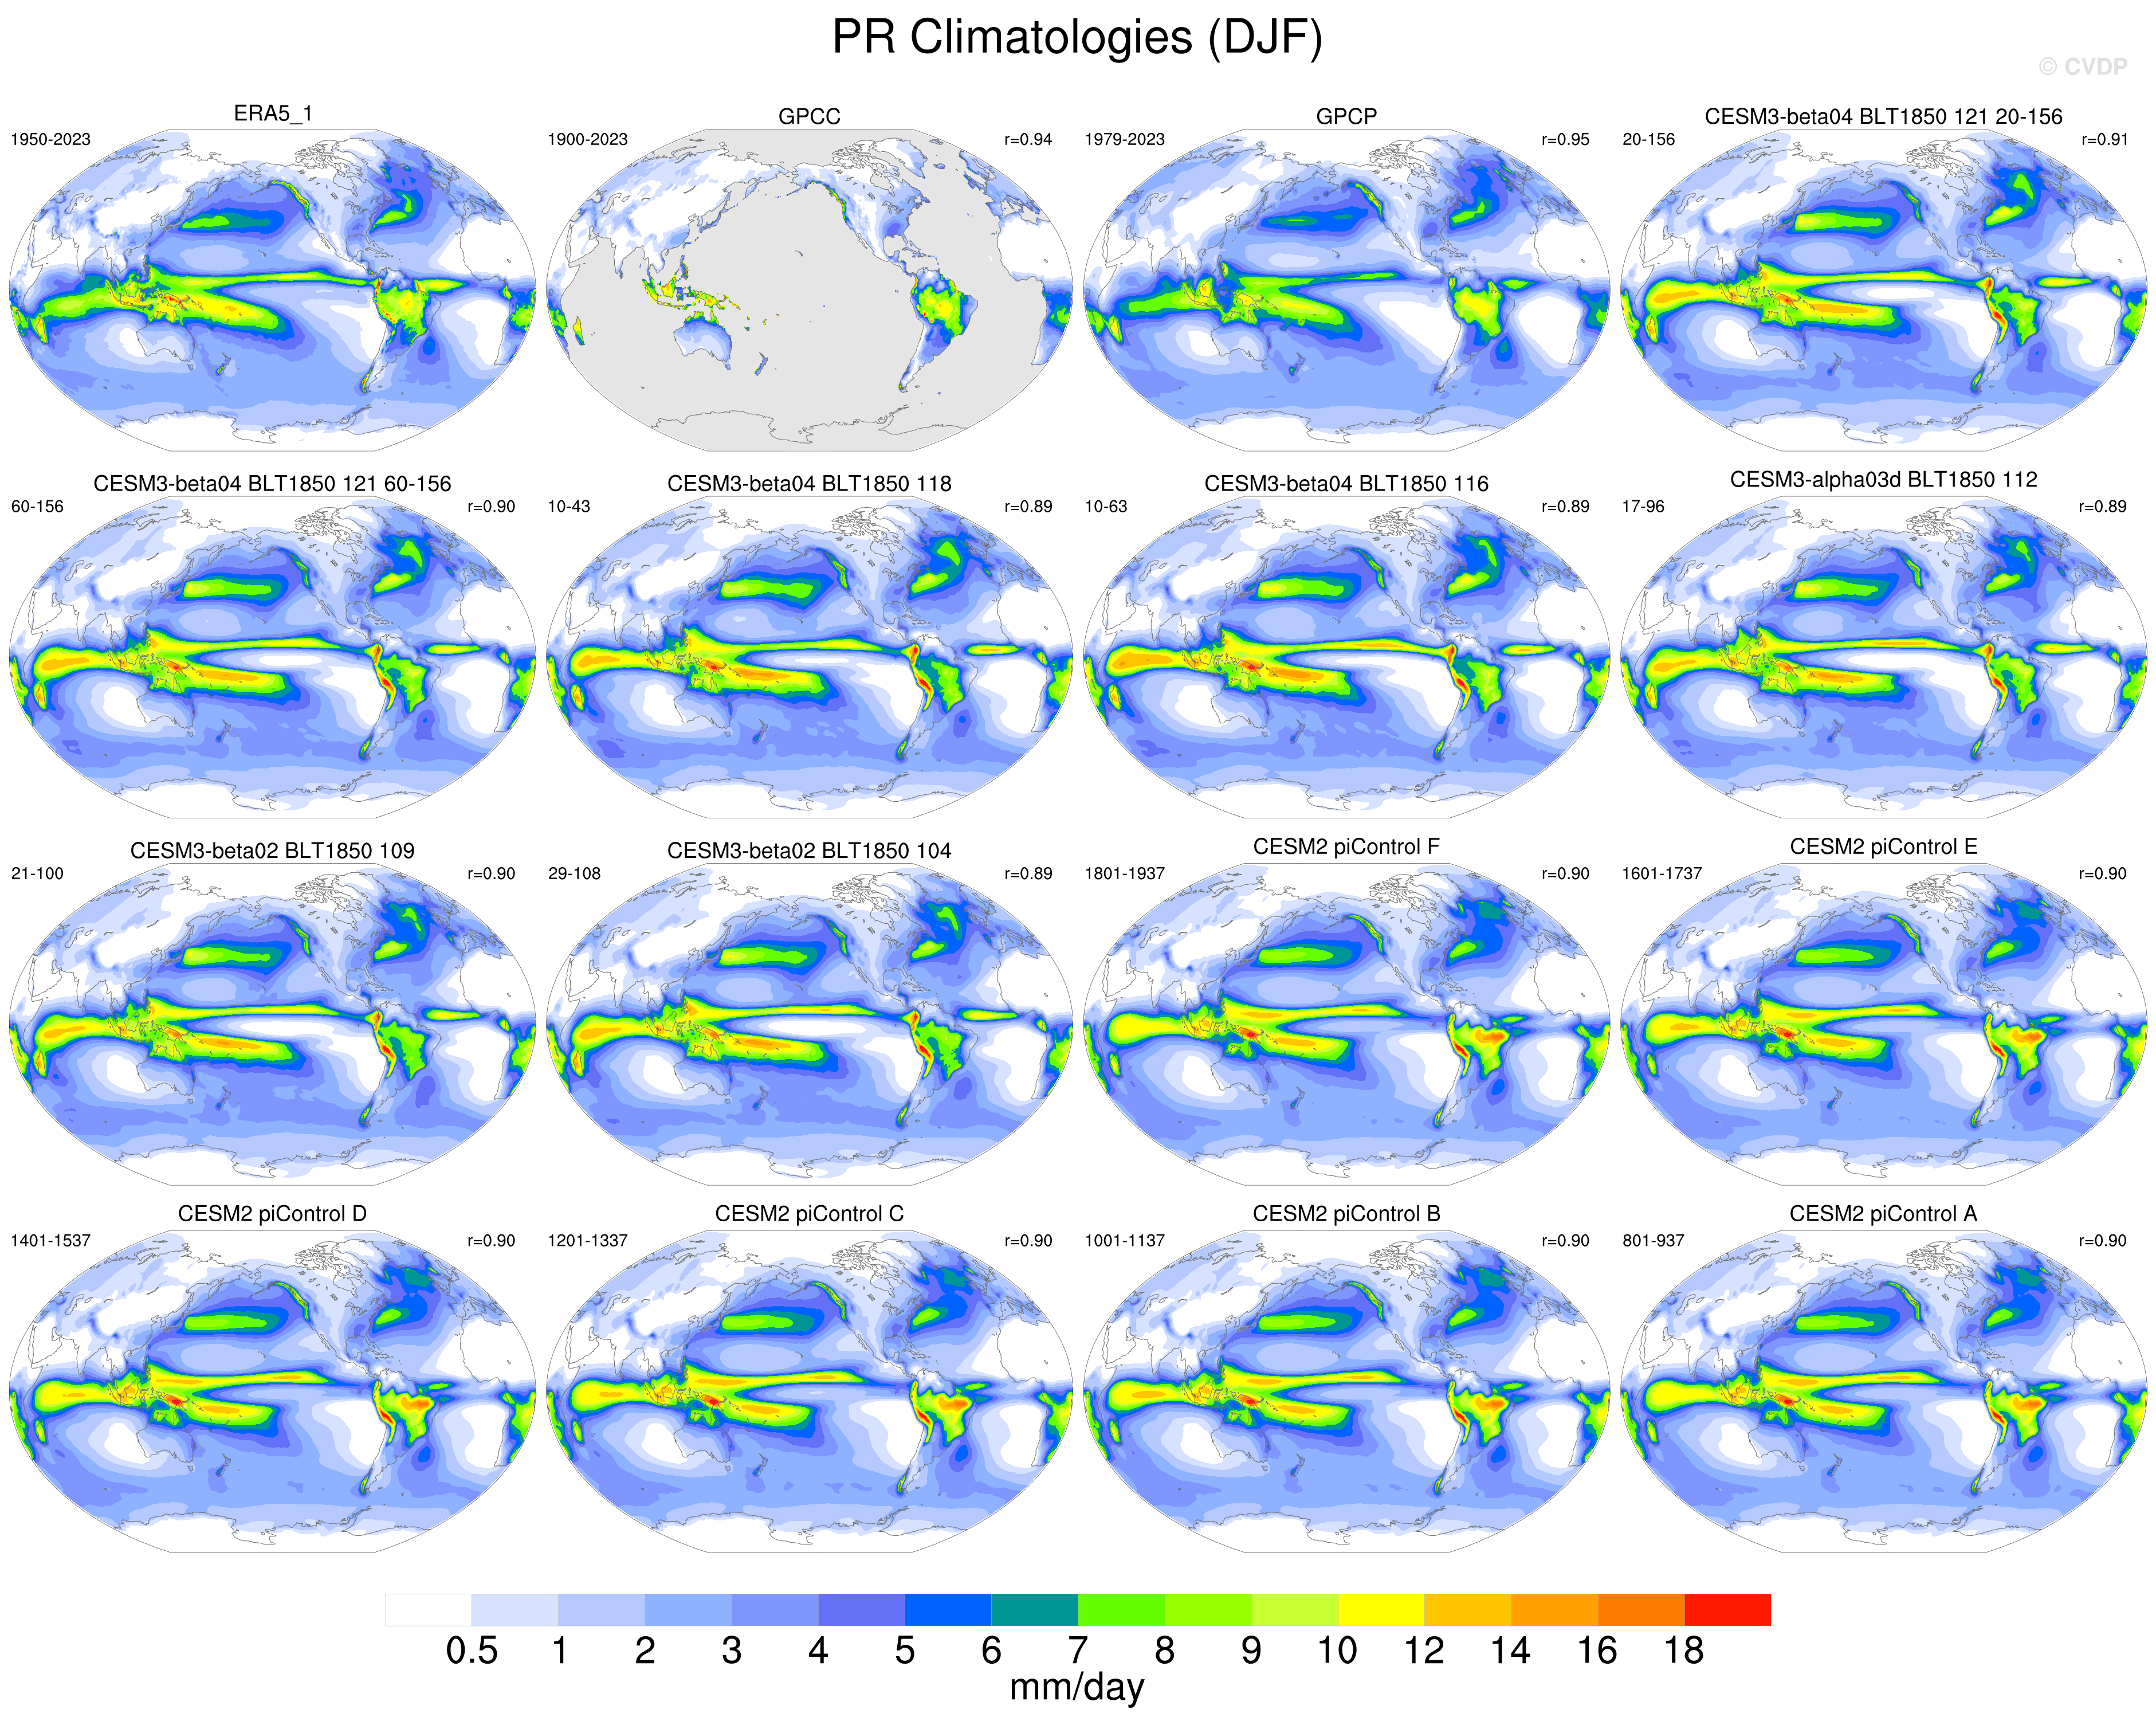
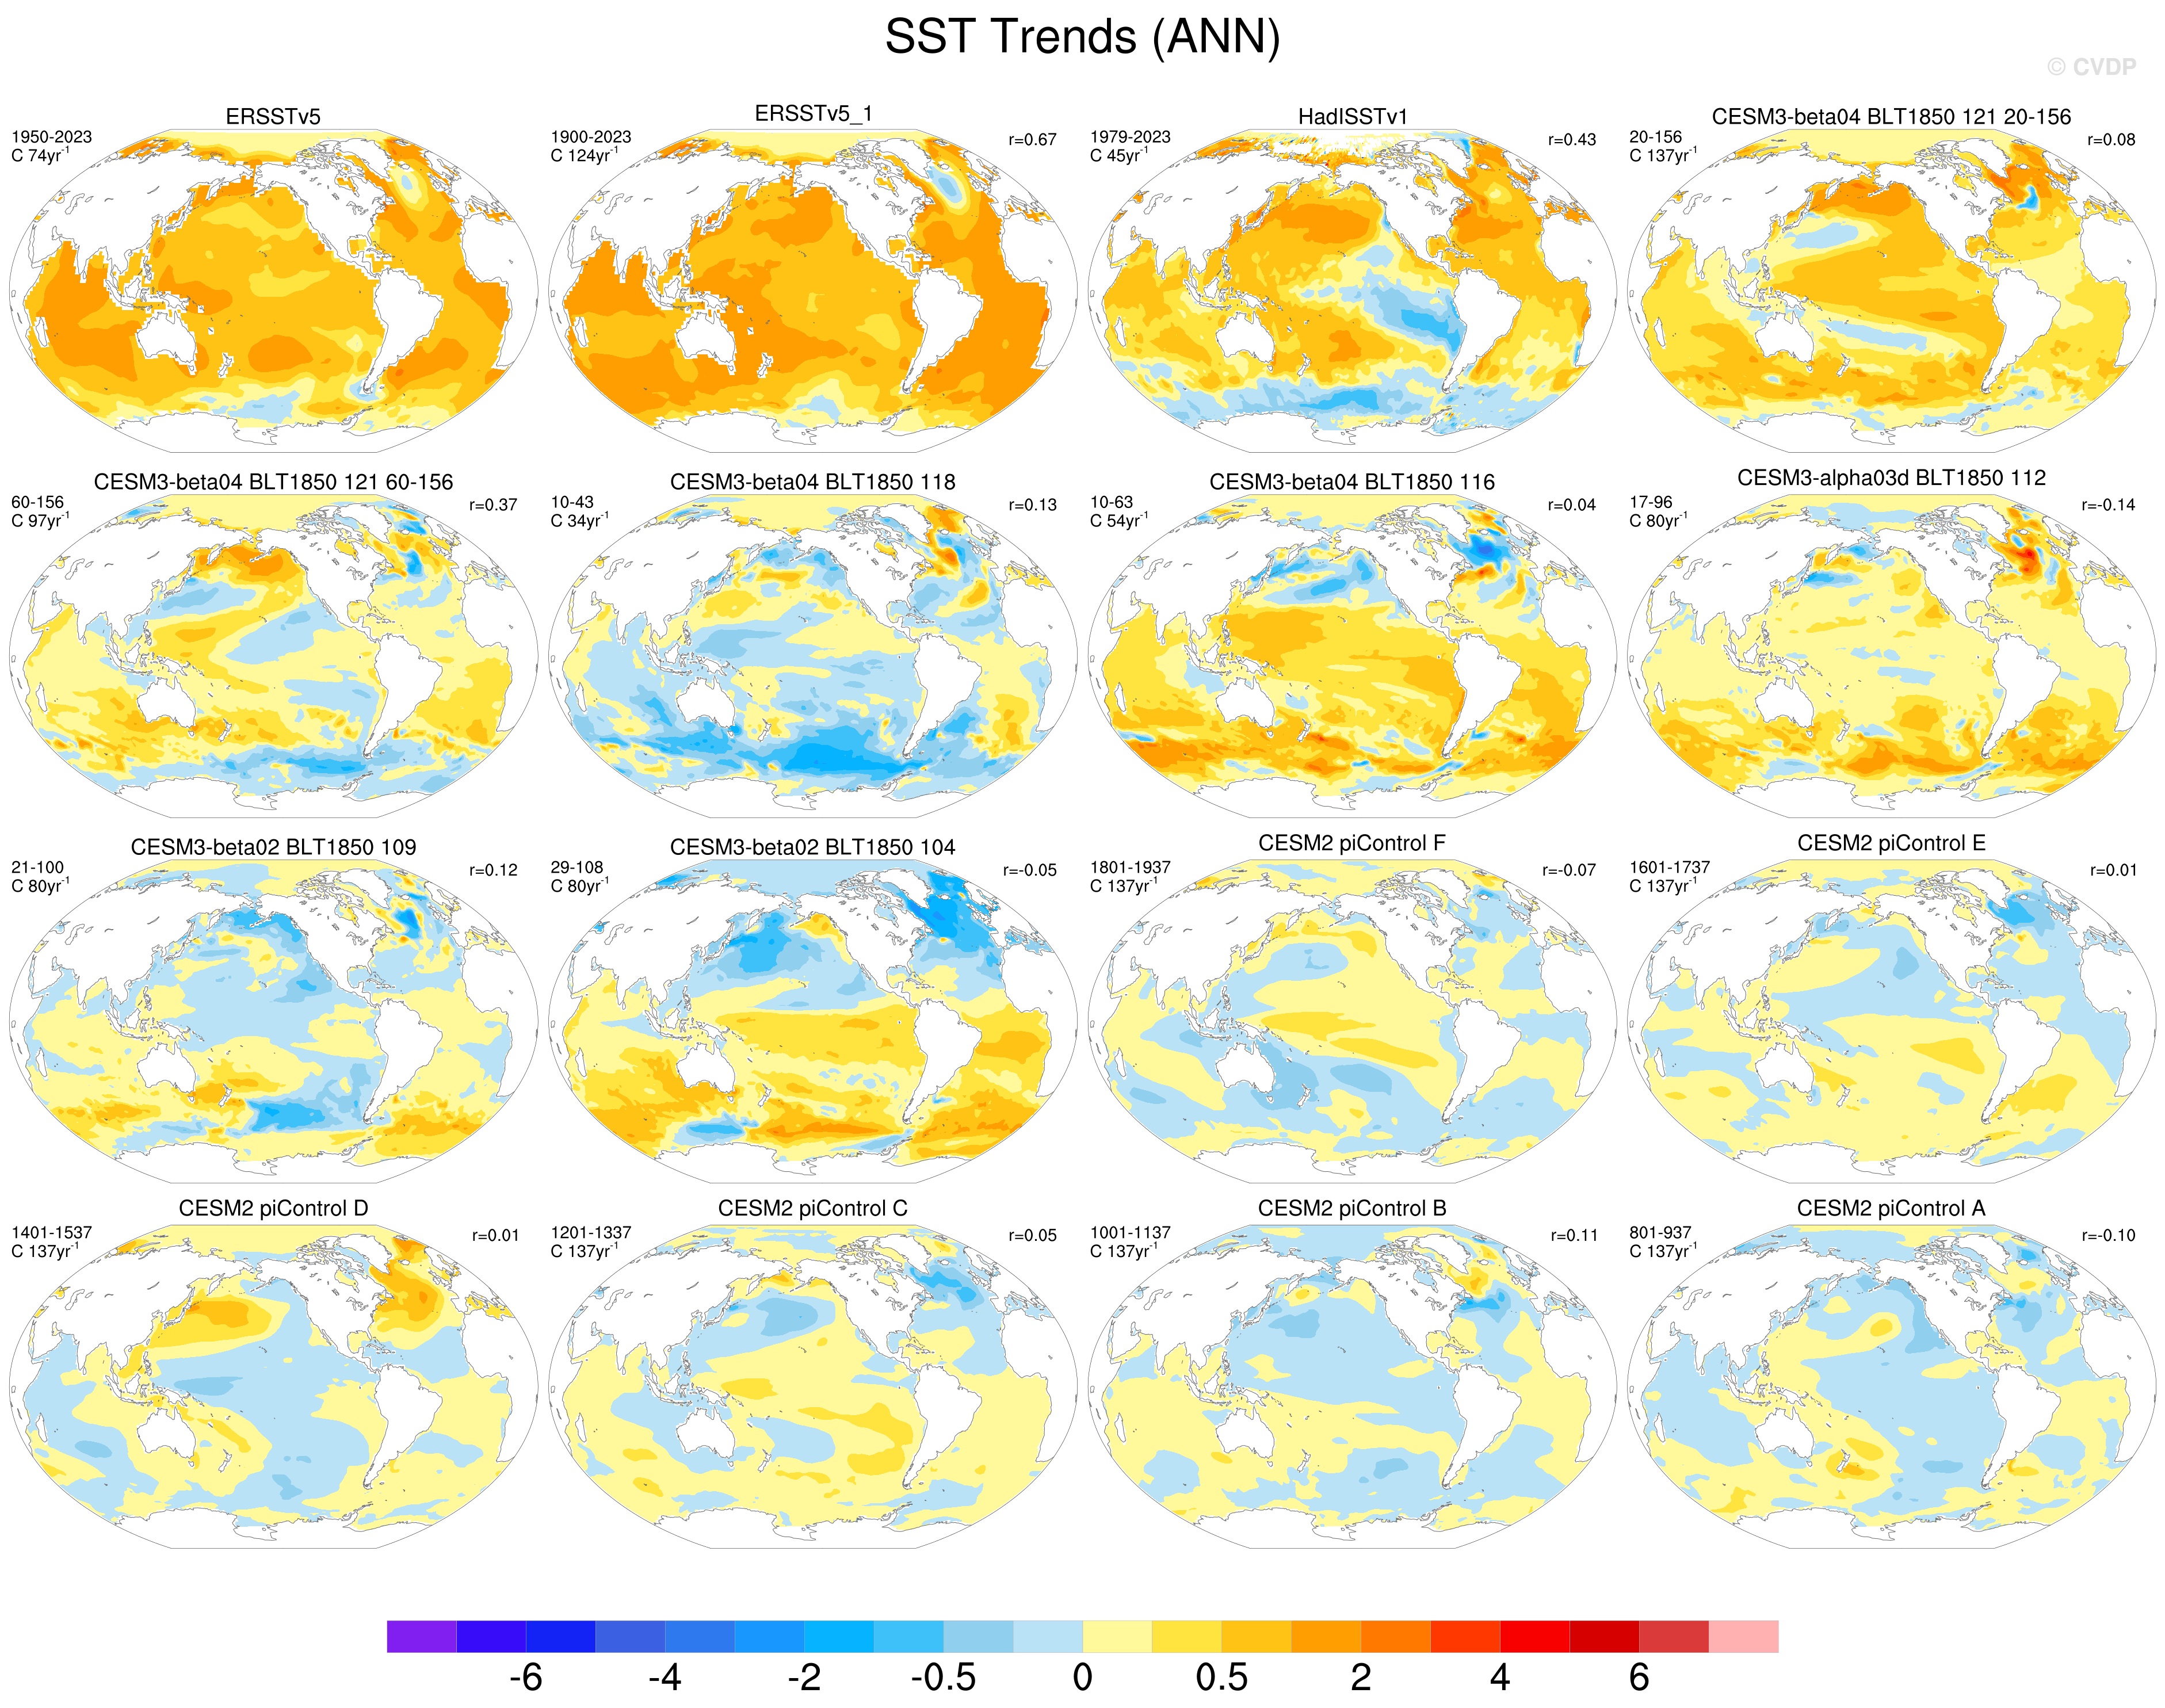
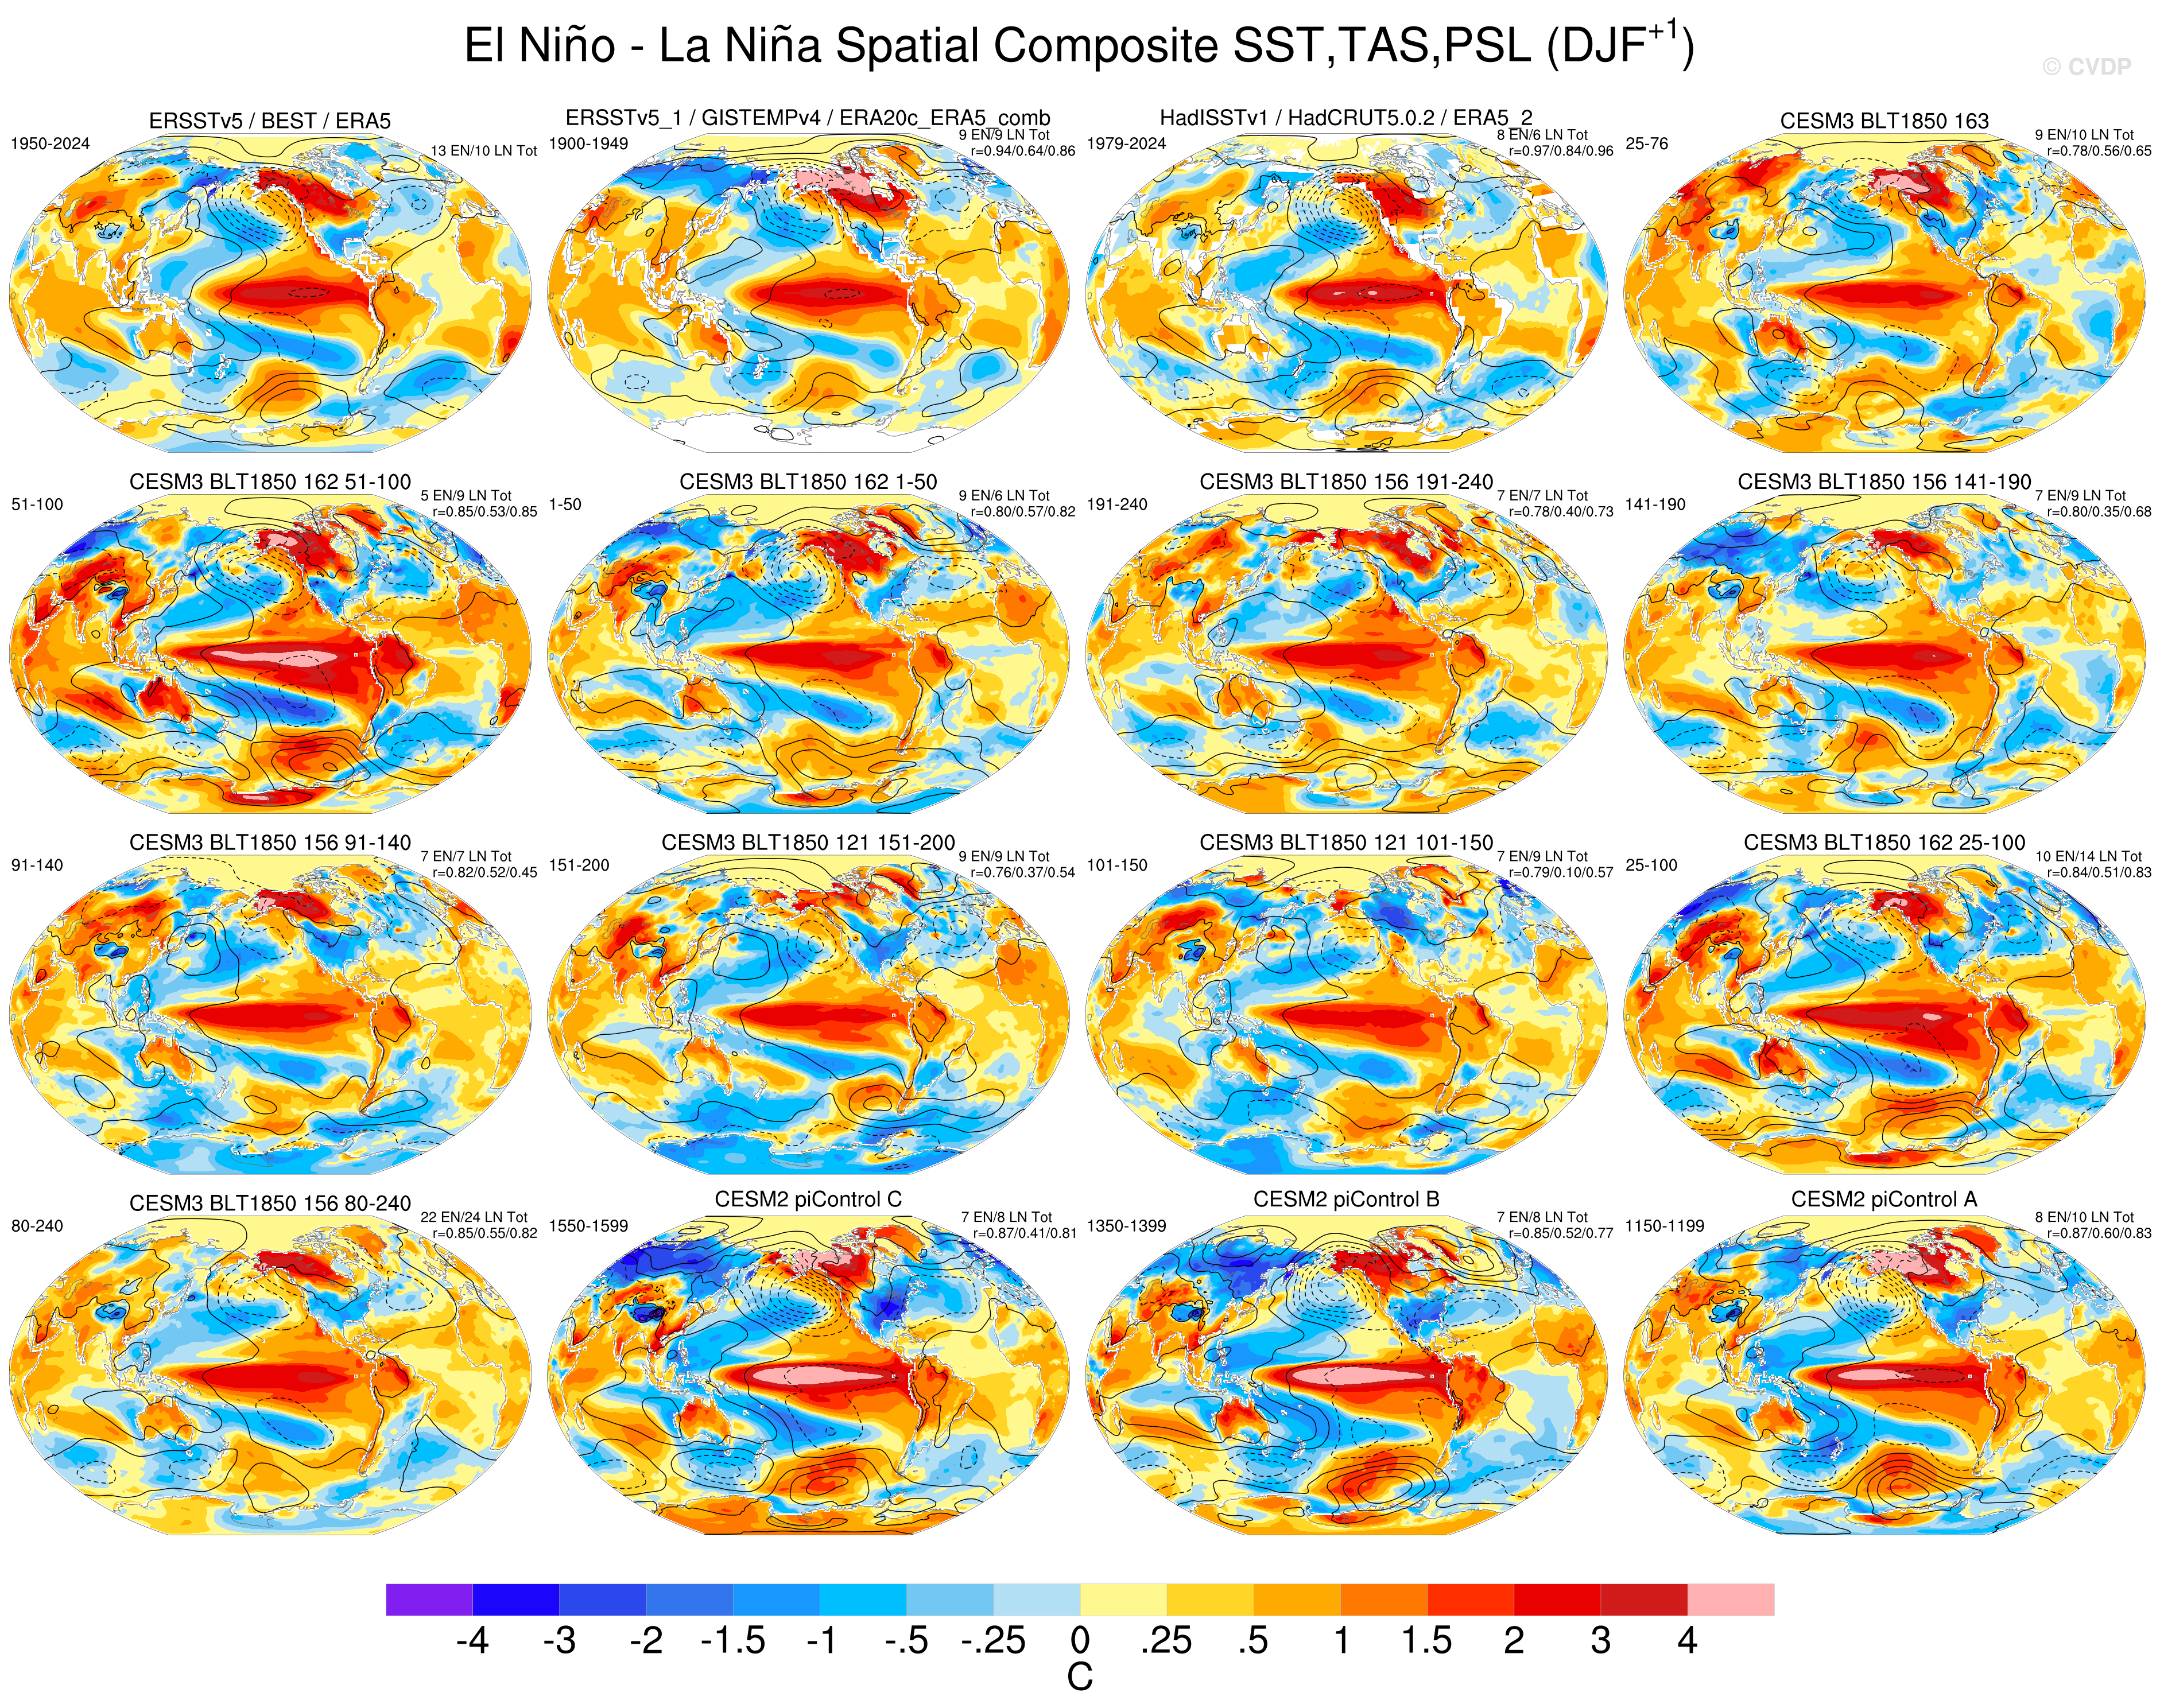
I have run two 121 time periods through the CVDP, years 20-156 and 60-156, with results here. For most of the plots, note the full 121 time period is in the upper right, while the shorter 60-156 time period is the first plot in the second row. The last 6 plots are time slices from the CESM2-picontrol. I do not see much of a difference at all between the 121 metrics for years 20-156 and those for years 60-156. Overall, 121 seems to be a positive step forward. ENSO teleconnections, nino3.4 spectra and hovmollers, sst standard deviations in the tropics and the tropical pacific dry slot are all improved and/or near the best seen in the 1XX series of runs. 121's La Nina Hovmoller plot shows a particular improvement with capturing a 2nd year La Nina which is great to see. |

Beta Was this translation helpful? Give feedback.

-
|
Hi Adam. It looks like to me, although perhaps it's too early to tell, that run 121 has transitioned to a more balanced equilibrium sometime after year 100, with RESTOM lower and global SSTs stabilizing. I'm wondering if the SST trends will be less in the second century.
|

Beta Was this translation helpful? Give feedback.
-
|
Thanks for the diagnostics @phillips-ad. I put some of them in the slides for the project meeting tomorrow. Feel free to add anything else you think is important that I may have missed. |
Beta Was this translation helpful? Give feedback.
-
|
In 156/160/162 I continue to get poor scores in CMAT, mainly related to low ENSO teleconnections scores. The attached plot shows the Jul-Jun teleconnection analysis for 156. The biases against ERA5 are shown in the bottom left and resemble in many ways the changes from CESM2 in the bottom right - and thus the model is quite biased and also worse than before, with excessive zonal extent in both the eastern and western Pacific. Extratropical responses suffer and exhibit a westward displacement. |

Beta Was this translation helpful? Give feedback.
-
|
It would be good to understand this along slide the CVDP diags. here https://docs.google.com/presentation/d/1rTfw3zglYzJUe8JQHYfsd5mDU5XYFPd7eX0mzlwsGhs/edit?slide=id.g3567c083acb_0_20#slide=id.g3567c083acb_0_20 |
Beta Was this translation helpful? Give feedback.
-
|
@jfasullo it looks like you are looking at 30 years of 156 is that correct? If so I am guessing the shorter time-slice (vs. 50 year slices shown in the CVDP) explains the difference. |
Beta Was this translation helpful? Give feedback.
-
|
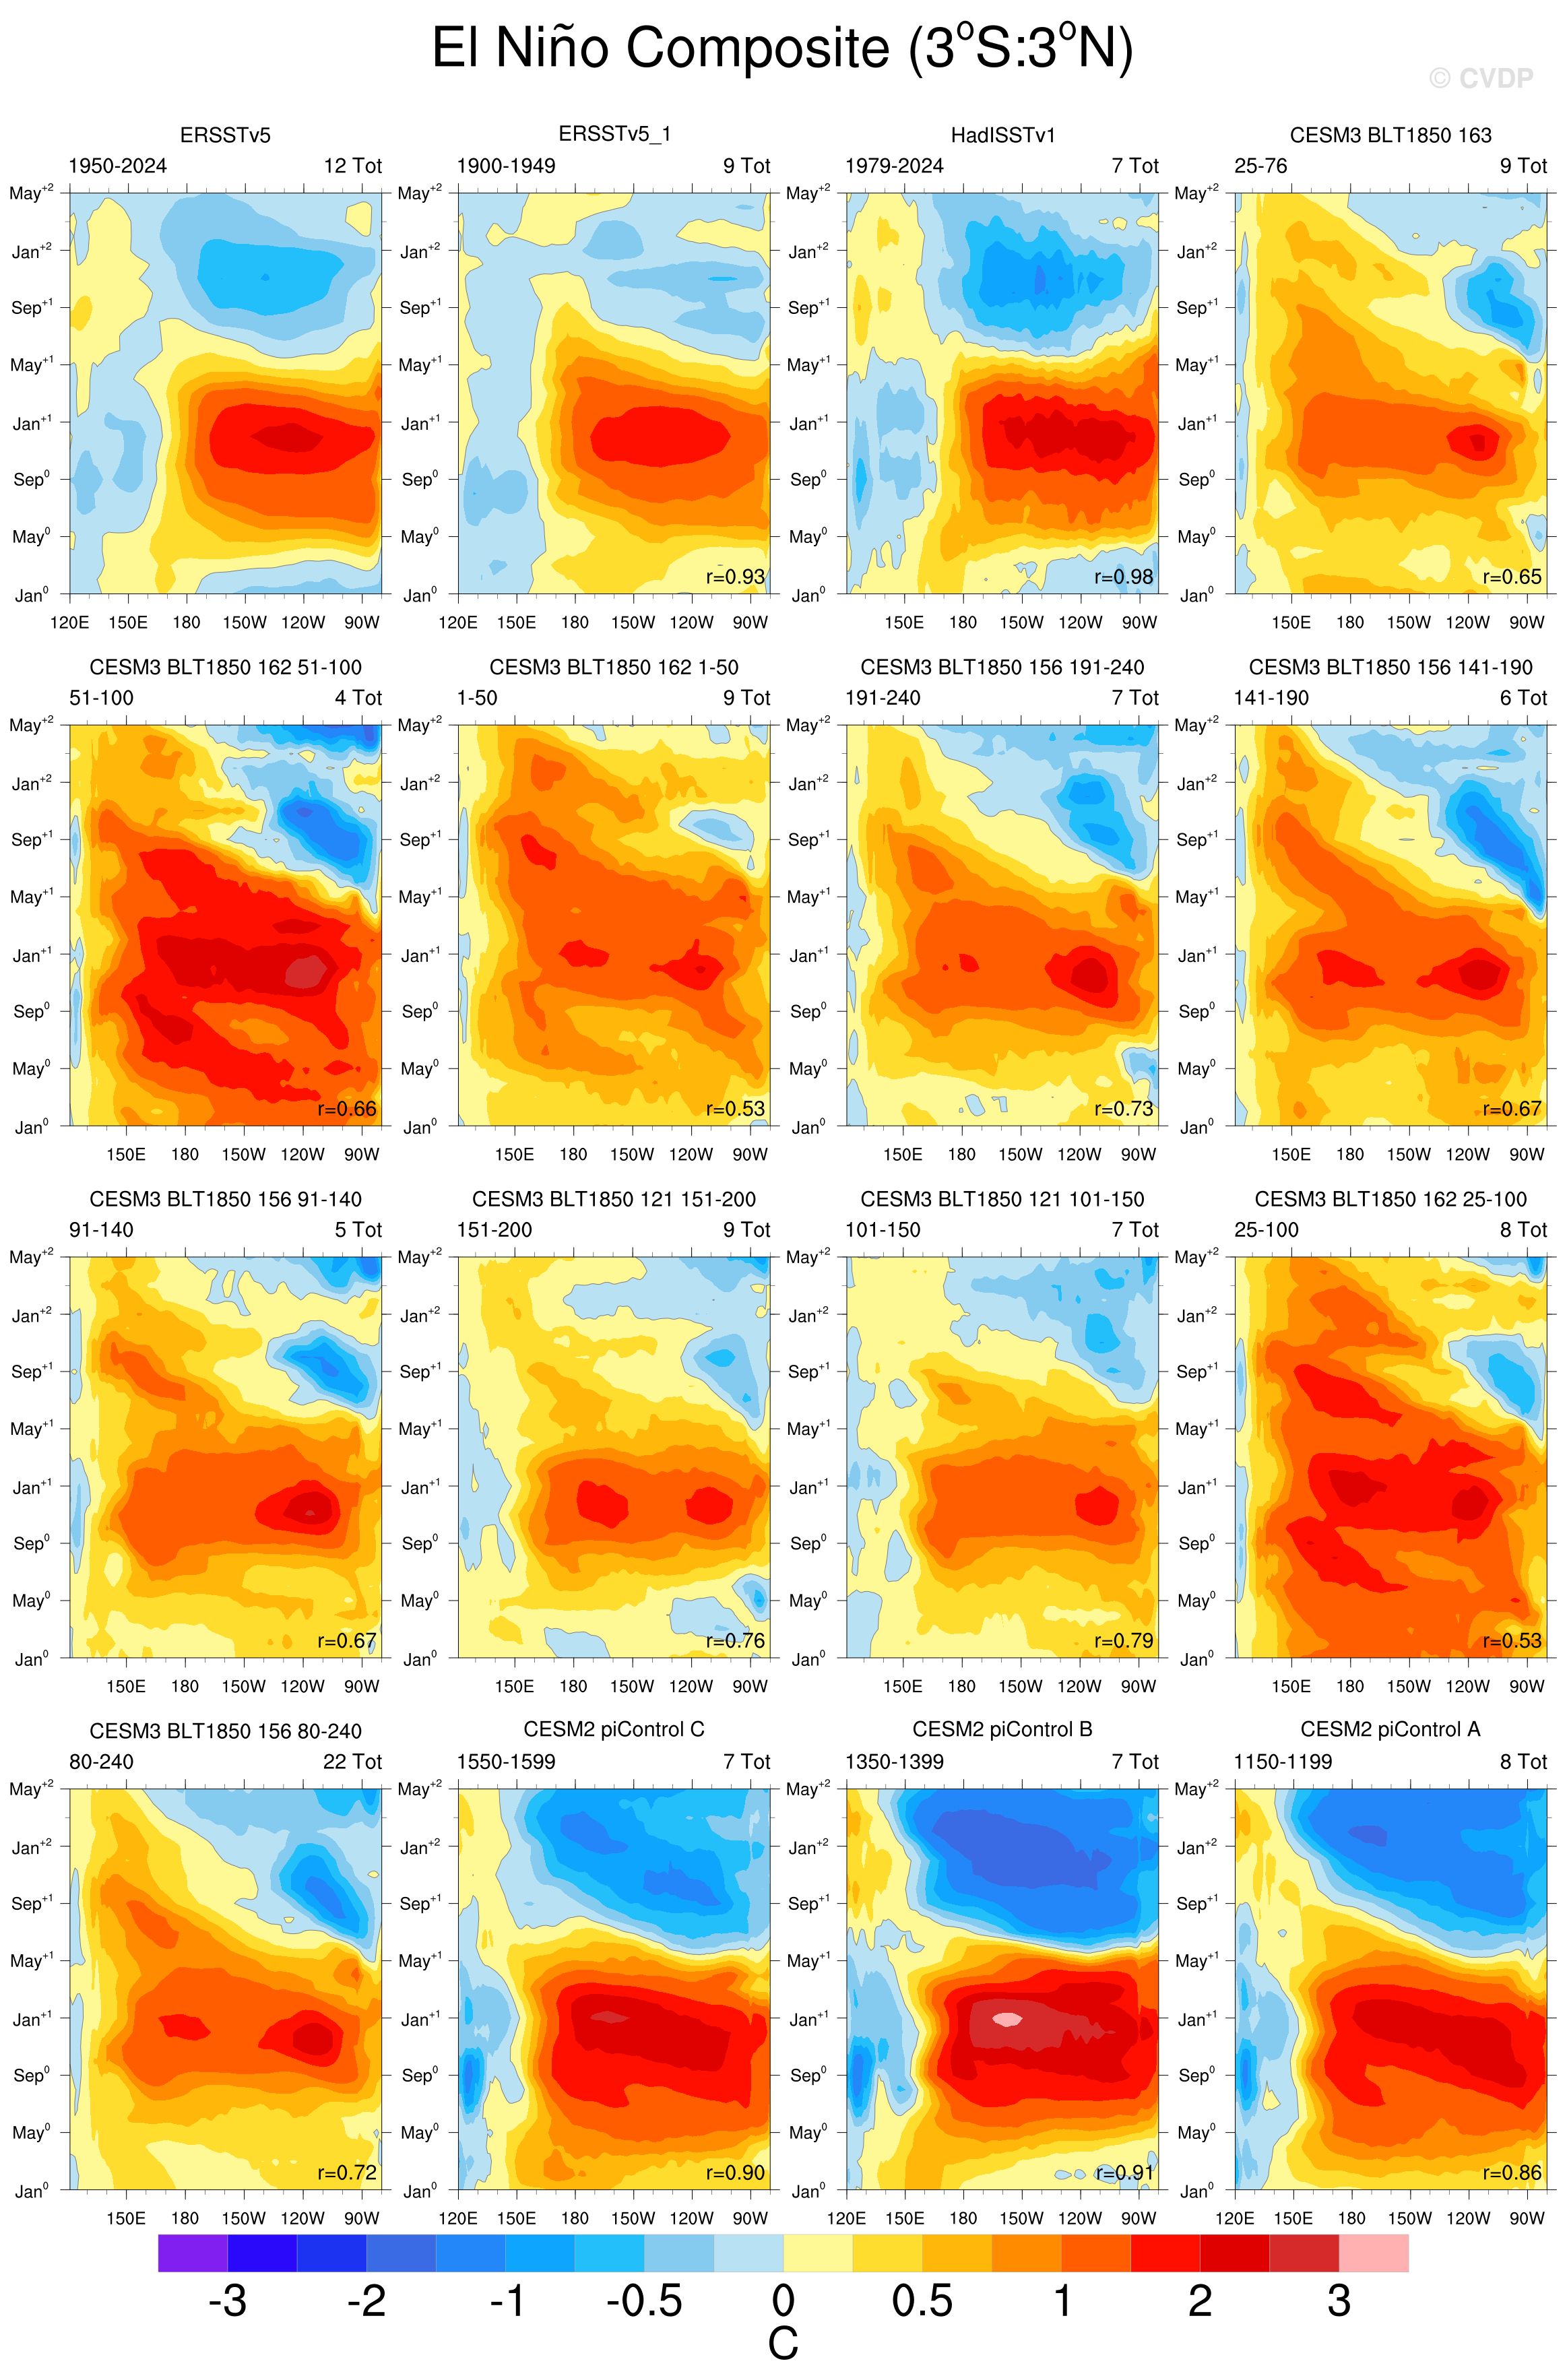
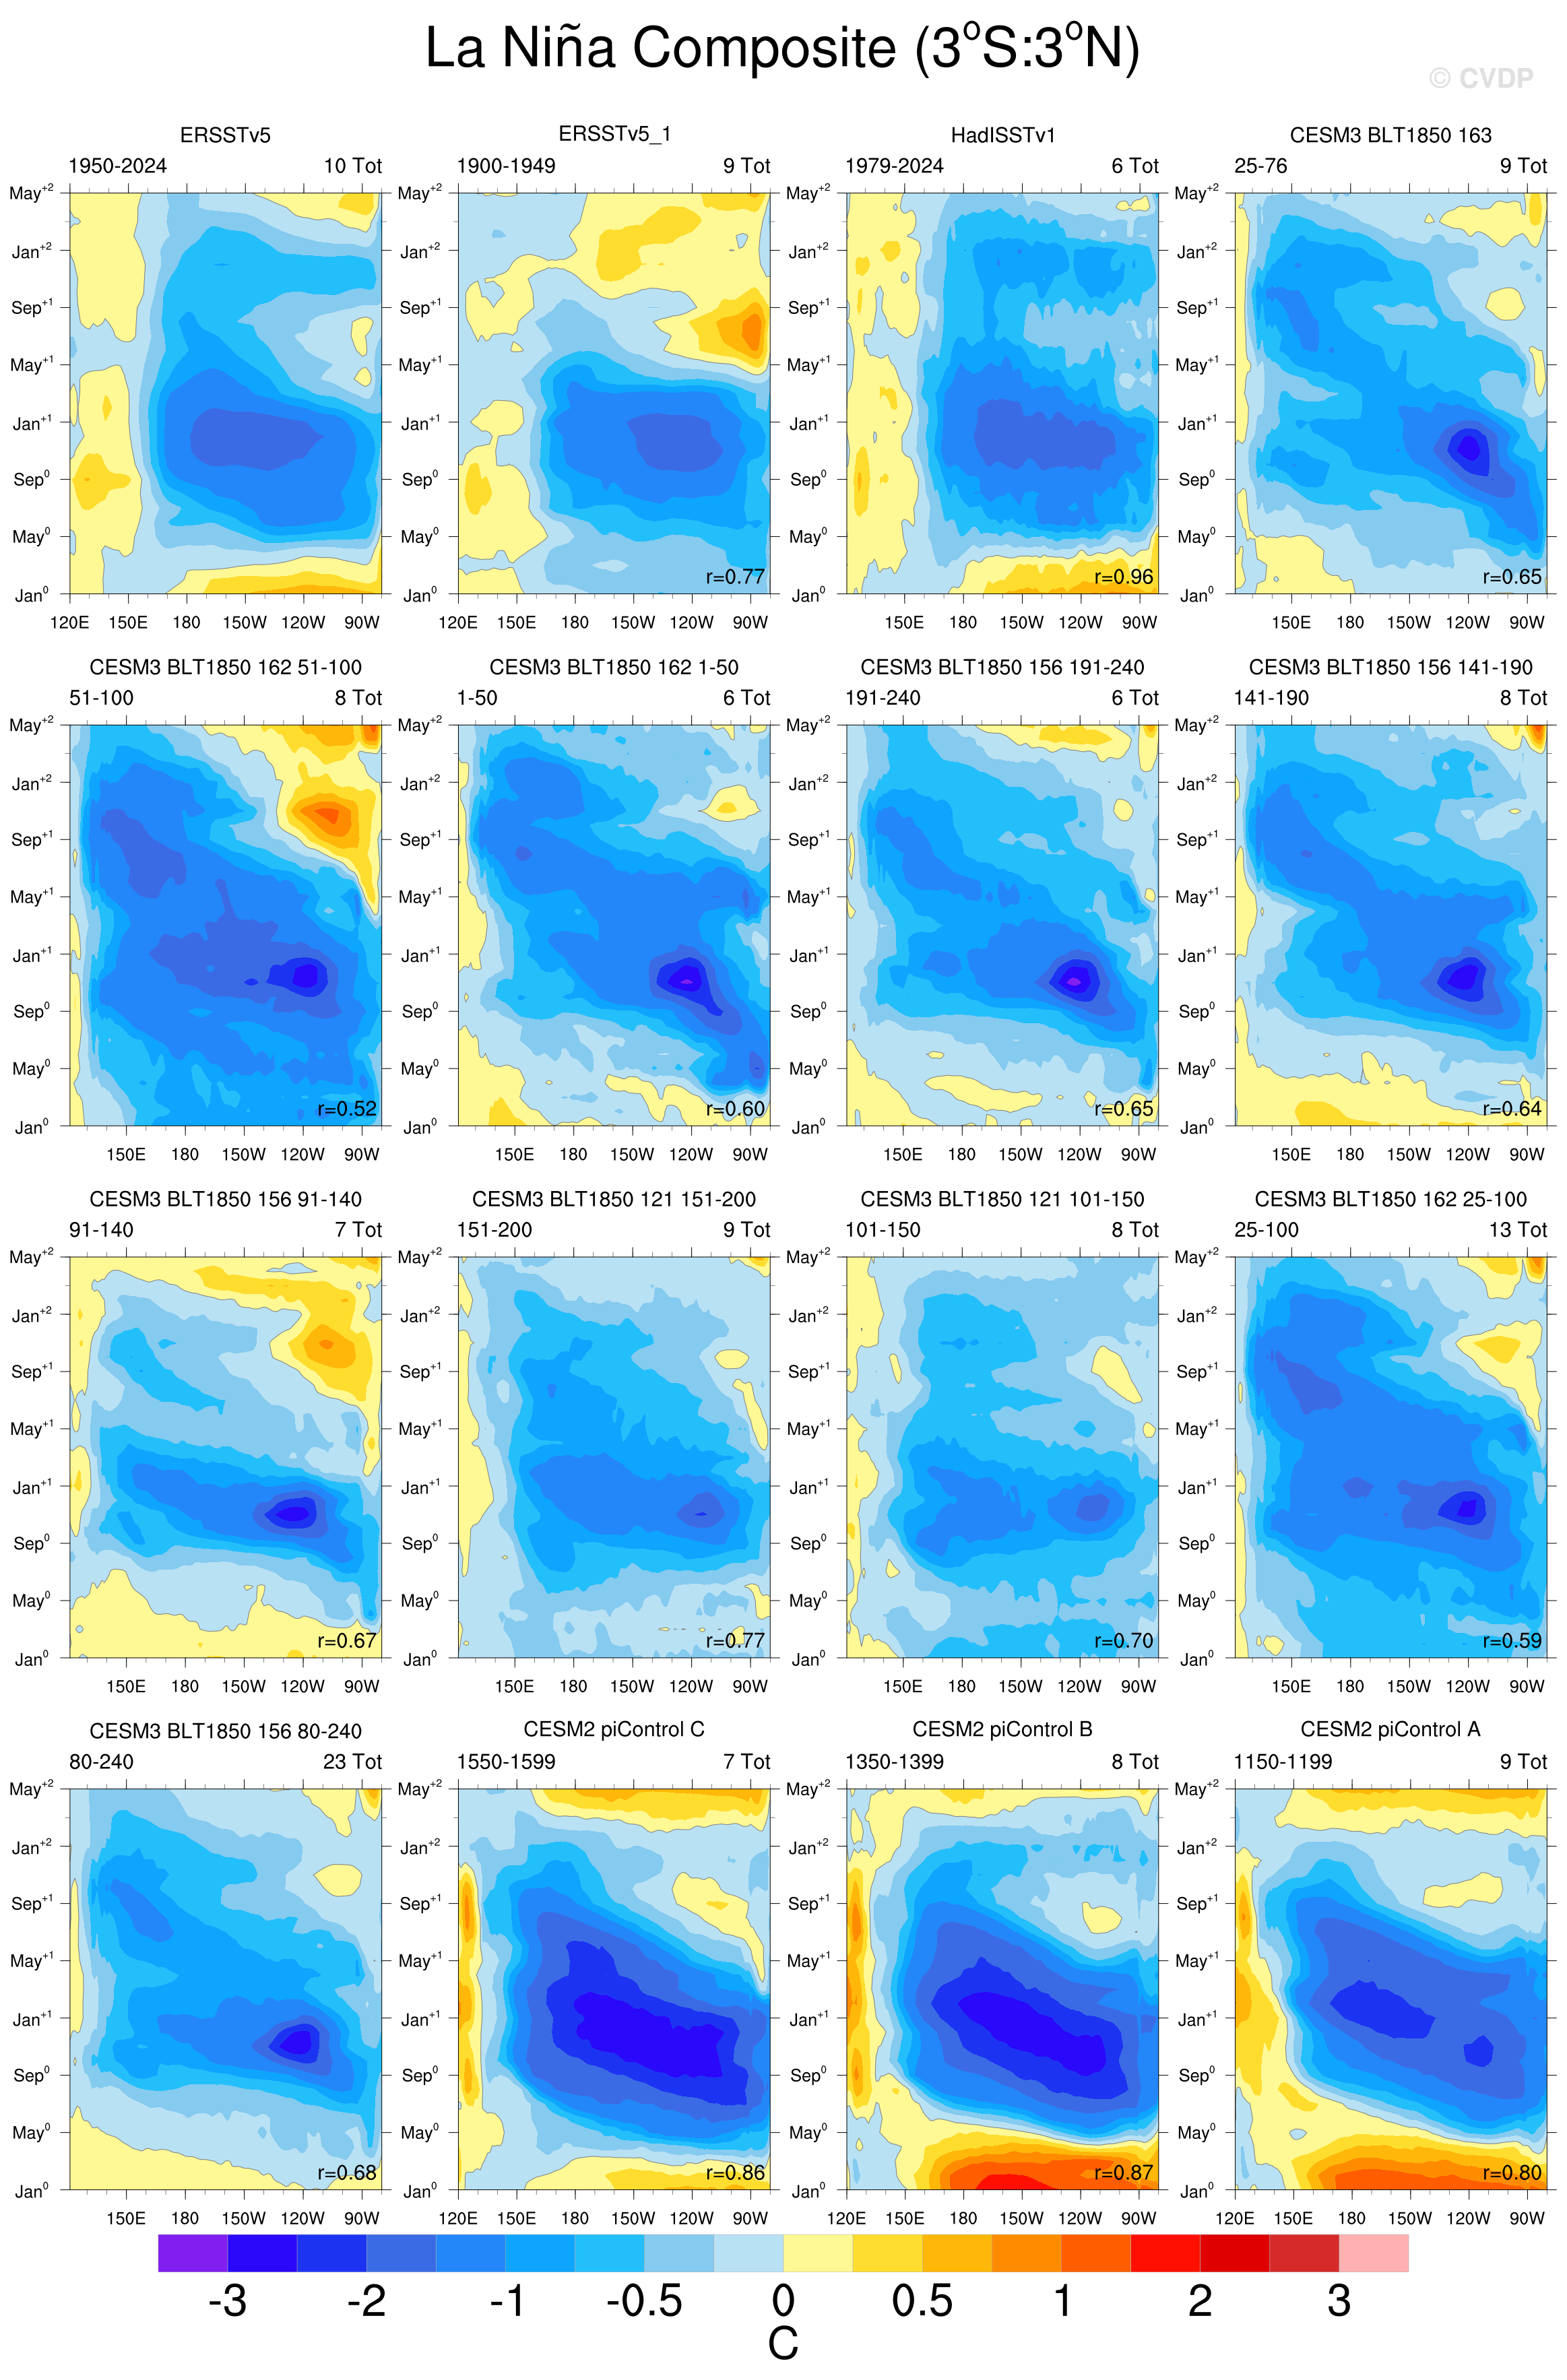
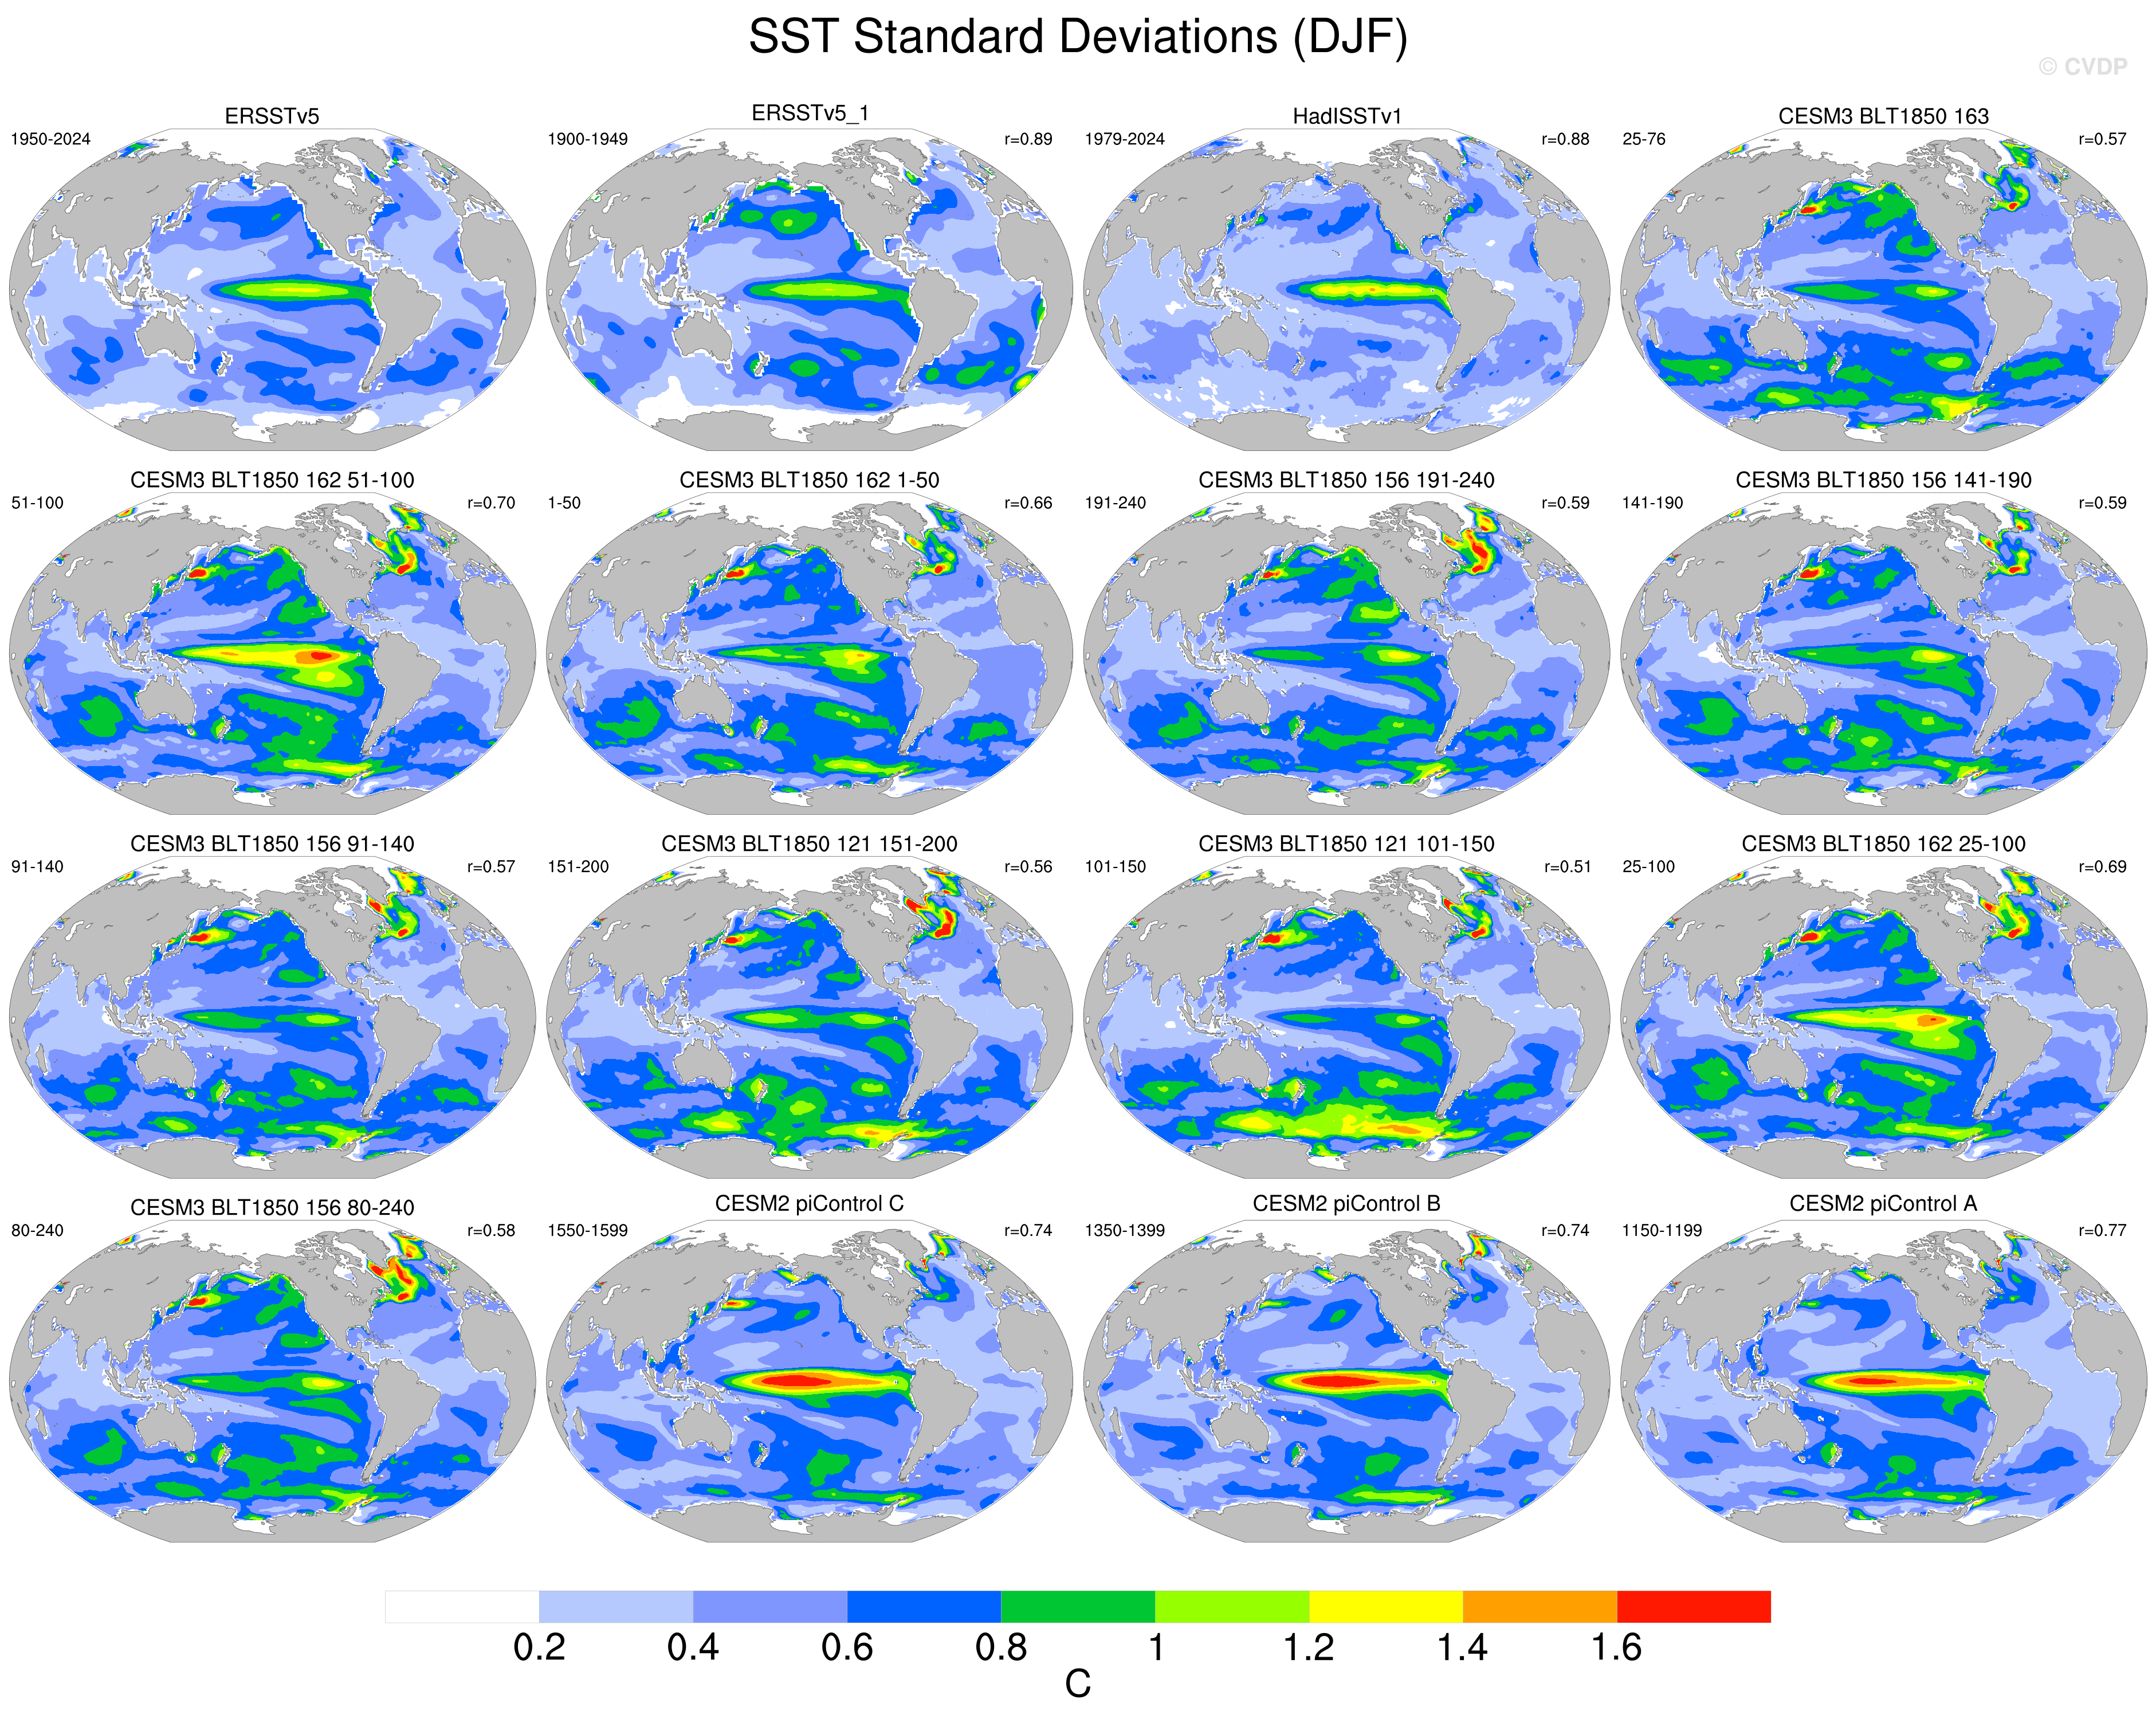
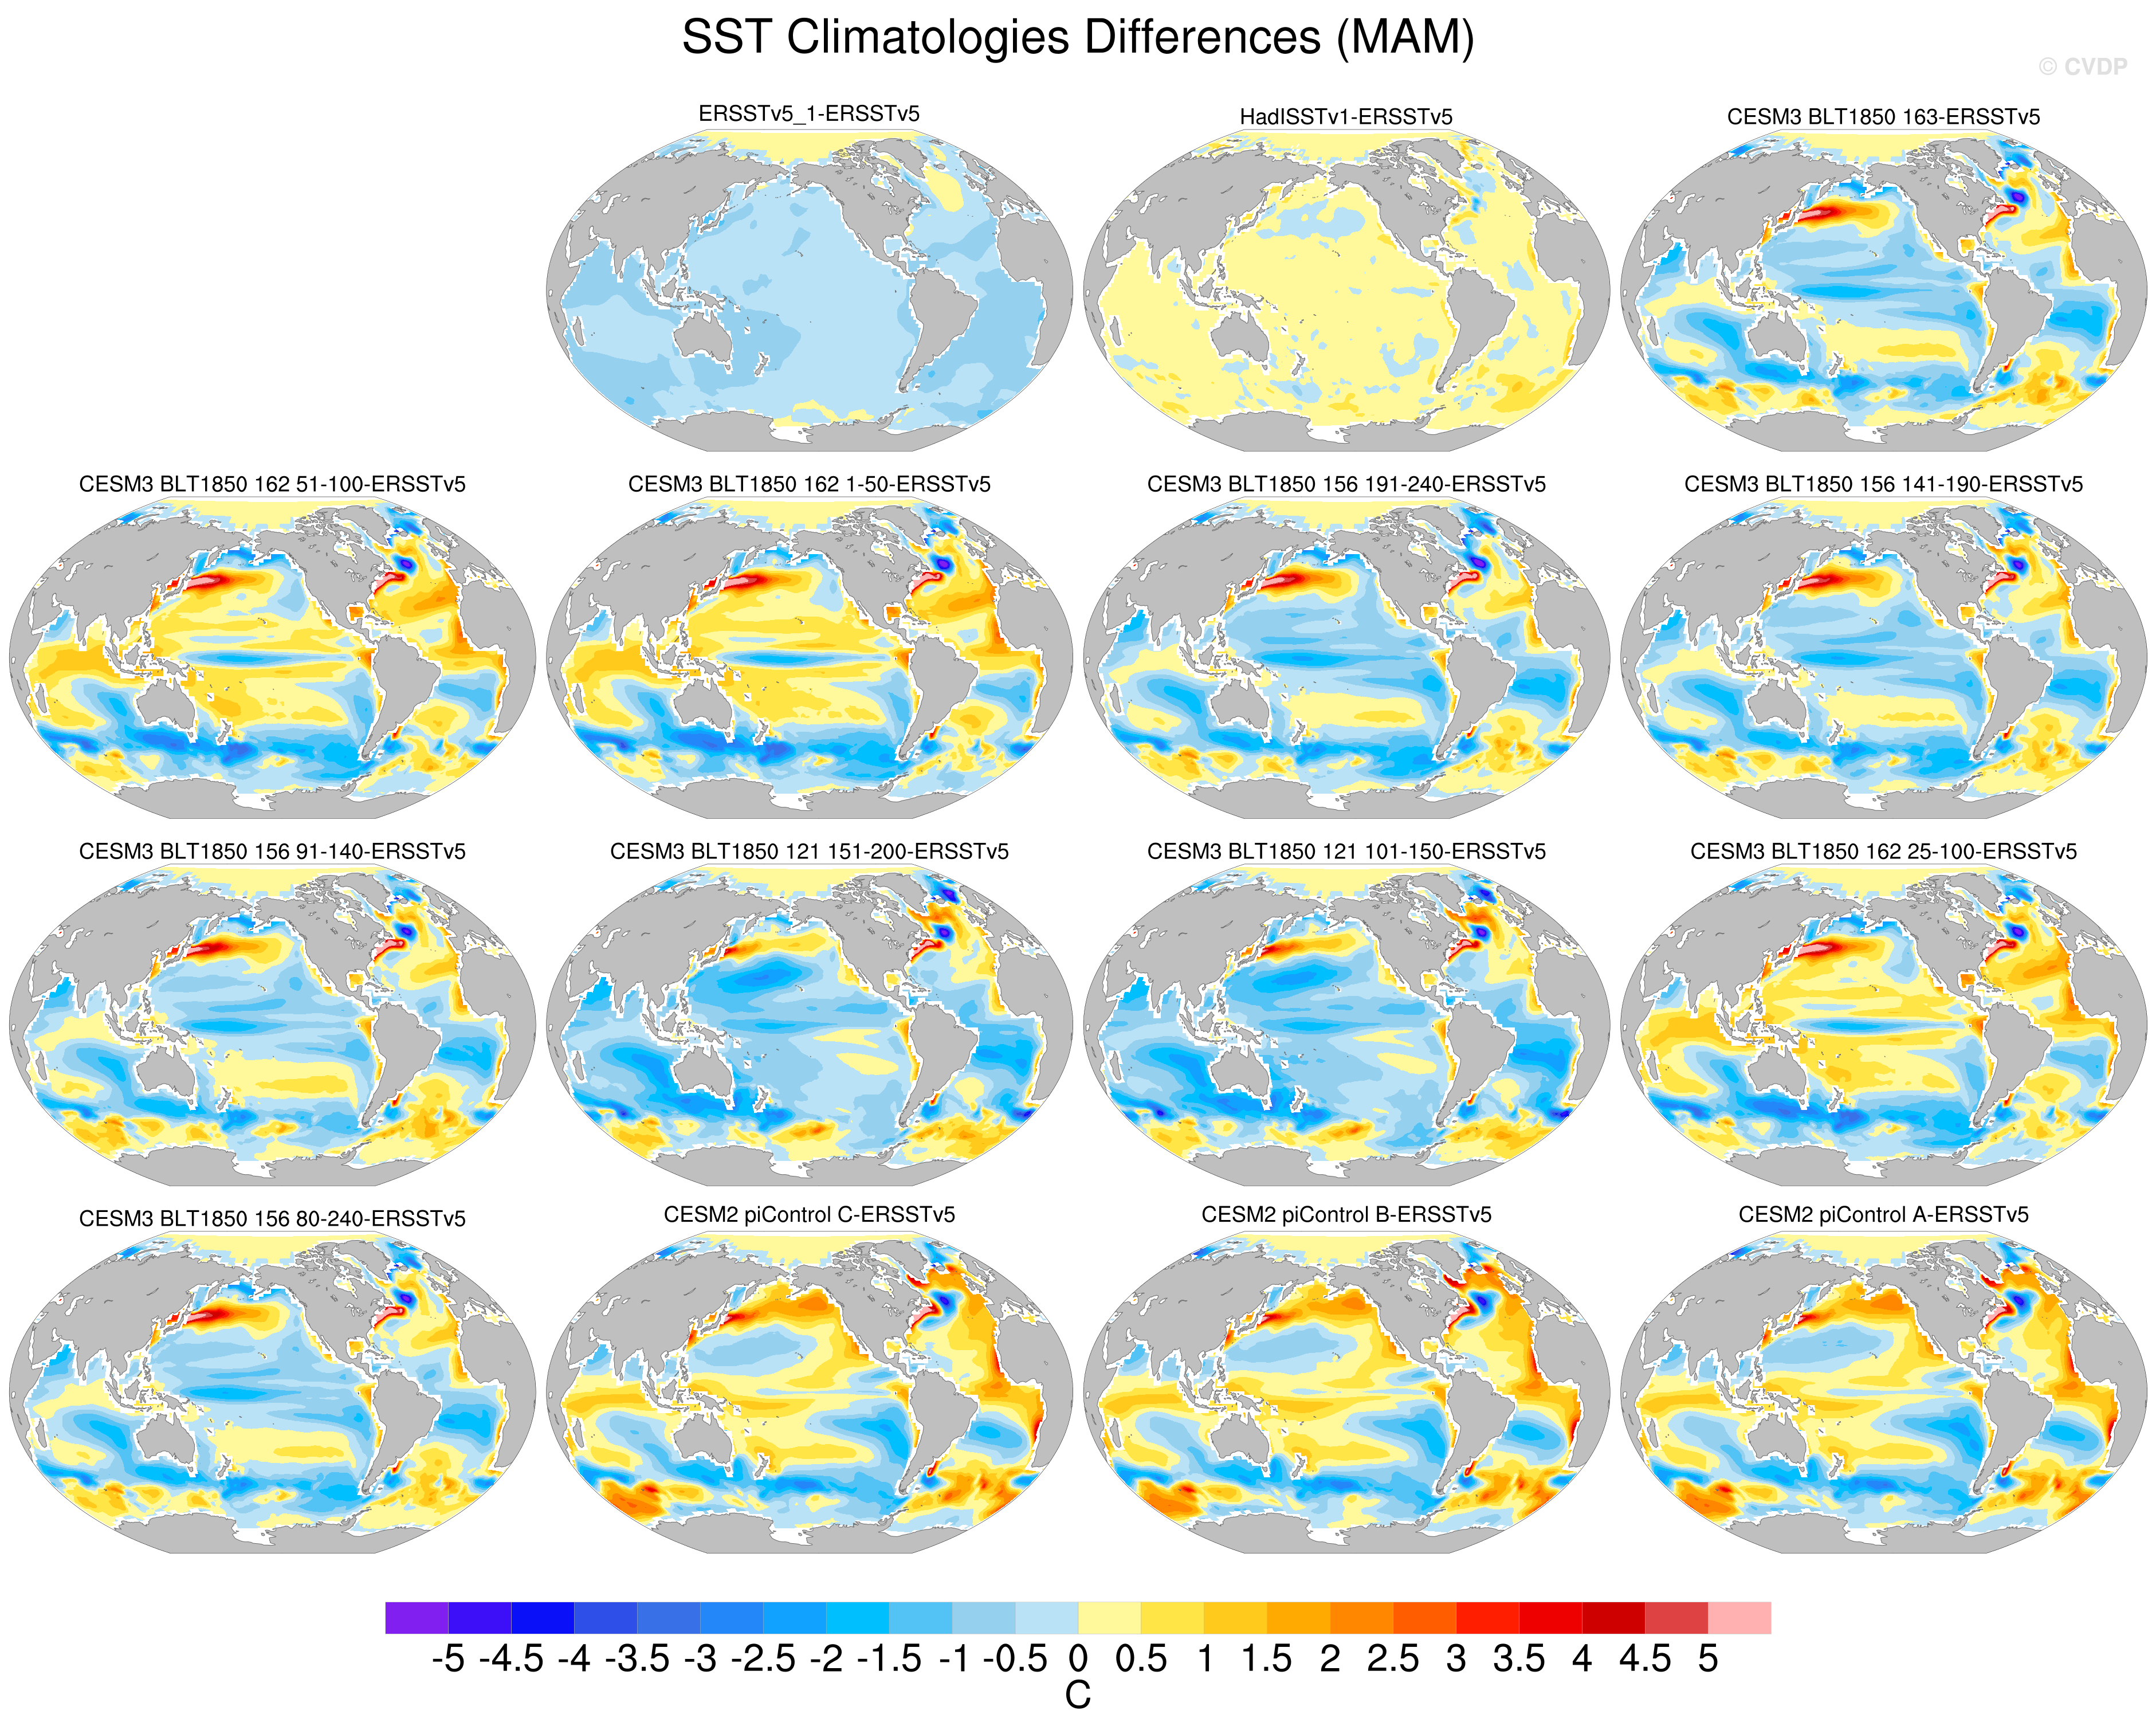
I have created a CVDP comparison using the following simulations and time slices:
The comparison is here: A few items are notable:
|
Beta Was this translation helpful? Give feedback.
-
|
These are really great to look through! I wonder if the mean SST bias pattern might be leading to the odd seasonal cycle in 162? The warm bias around the ITCZ stands out compared to other sims there, but this isn't a plot I look at often! Do you have a sense of whether this is anomalous for most CESM3 simulations? |
Beta Was this translation helpful? Give feedback.
-
|
Are the obs. 1850 SSTs? |
Beta Was this translation helpful? Give feedback.
-
|
Yah @swrneale nailed it. The SST's are being compared to 1950-2024 ERSSTv5. And the Tropical Pacific cold bias region (which might not be so cold when compared to 1850's SSTs) is also seemingly sitting right under CESM's usual dry slot bias. I think @islasimpson has brought this up before. |
Beta Was this translation helpful? Give feedback.
-
|
Looking at ENSO teleconnections to precipitation in 170-2 I found them to very poor - extending zonally across the Indo-Pacific (attached). Teleconnections in 180 are improved, yet the precipitation teleconnections don’t look quite as good in 178/9 as 180 (attached), though still improved from 170-2 at about r=0.4. Pattern correlations are 0.48, 0.51, and 0.63 respectively, differences that may (but probably don’t) arise from internal variability. The strength over the maritime continent suggests an anchoring by the warm SST biases? The dry |


Beta Was this translation helpful? Give feedback.
-
|
I see a fairly dramatic difference in ENSO teleconnections between 234pi and 235pi - with 234 being the better performer. See for example the ENSO PSL teleconnections in CMAT |

Beta Was this translation helpful? Give feedback.
-
|
CMAT scores continue to improve in CESM3 and 237 is one of the best runs in a while based on these (within the noise of 234). |

Beta Was this translation helpful? Give feedback.
-
|
I think this is consistent with 235 having much weaker ENSO variance. Pasting a slide here from the project meeting for the records. It sounds like 235 is not viable from the oceanographers perspective. It'll be interesting to see how things evolve in 236 when it's running. 
|
Beta Was this translation helpful? Give feedback.
-
|
The most recent versions of CESM3 continue to score well in CMAT. #245 shows some of the best overall scores on record. |

Beta Was this translation helpful? Give feedback.
-
|
The newer versions of the model continue to score well in CMAT. Here a number of runs are sorted by overall score. |

Beta Was this translation helpful? Give feedback.
-
|
The historicals of 271/276 both score quite well in CMATv1. |

Beta Was this translation helpful? Give feedback.
-
|
278 and 280 PI runs have unfortunately degraded in CMAT scores - likely beyond the range explainable by internal variability. Drift also looks substantial in 278. |

Beta Was this translation helpful? Give feedback.
-
|
Cleaned up table here: |

Beta Was this translation helpful? Give feedback.
-
|
Thanks. I'm a little surprised at how different 271 and 276. It seems like ENSO might be dominating in that? 276 has slightly higher (more biased) ENSO amplitude than 271 in CVDP diagnostics. Do you have a sense whether this is what's dominating here? |
Beta Was this translation helpful? Give feedback.
-
|
Yes, the annual means are slightly better (in pattern correlation) in 271 but the majority of the score difference is ENSO, as it typically is as the ENSO pattern is noisier. That said 271 scores 81 overall and 276 scores 75 and so that is a 6 sigma difference (if the CESM1 LE noise estimate is credible) and thus unlikely to be due internal variability alone. |
Beta Was this translation helpful? Give feedback.
-
|
ENSO teleconnections in the latest 307 and 308 simulations have very likely improved from those in 303 |

Beta Was this translation helpful? Give feedback.
-
|
Following on today's discussion regarding 311 as the new baseline, I've included it in the summary below. Similar scores as 307/308. |

Beta Was this translation helpful? Give feedback.
-
|
Attached is the summary table through 316, which scores pretty well. Still apparent issues with the near surface moisture fields (RH/LH) and albedo is high but otherwise quite a solid run. A detailed summary can be found at: https://webext.cgd.ucar.edu/Multi-Case/CMAT/CMATv1_CESM3dev/ |

Beta Was this translation helpful? Give feedback.
-
|
Nothing too concerning about 319/322/323. Albedo remains too high, particularly in the NH, and LH fluxes are too high over ocean / low over tropical land. But overall pretty solid with CMAT scores of 78/79 (vs 82 for CESM2). |

Beta Was this translation helpful? Give feedback.
-
|
The new historical simulations (315 and 316) look really good in CMAT with scores approaching the lower range of the CESM2-LE. The main change is in the water cycle. In part this is due to better scores in the ENSO teleconnections in water cycle fields (PE, P). In part this also is due to the PI-increment, which is added to PI simulations with the goal of providing a better comparison to observations. In CMAT this increment is based on the CESM1-LE. It appears however that the spatial structure of this adjustment in CESM1 is quite different than what it is in CESM3 - and thus made CESM3 look worse than it should have. Of course we wouldn't know this without having CESM3 simulations through the end of the historical (with smoothed biomass) which we only have now. But really this is very good news. The only remaining item that gets flagged in CMAT is the hemispheric contrast in albedo with the SH being too bright. Aside from this, I'm pretty happy with either 315 or 316 based on the historicals. |

Beta Was this translation helpful? Give feedback.
-
|
The PI versions of 329, 330, and 331 all continue to score pretty well in CMATv1. |

Beta Was this translation helpful? Give feedback.
-
|
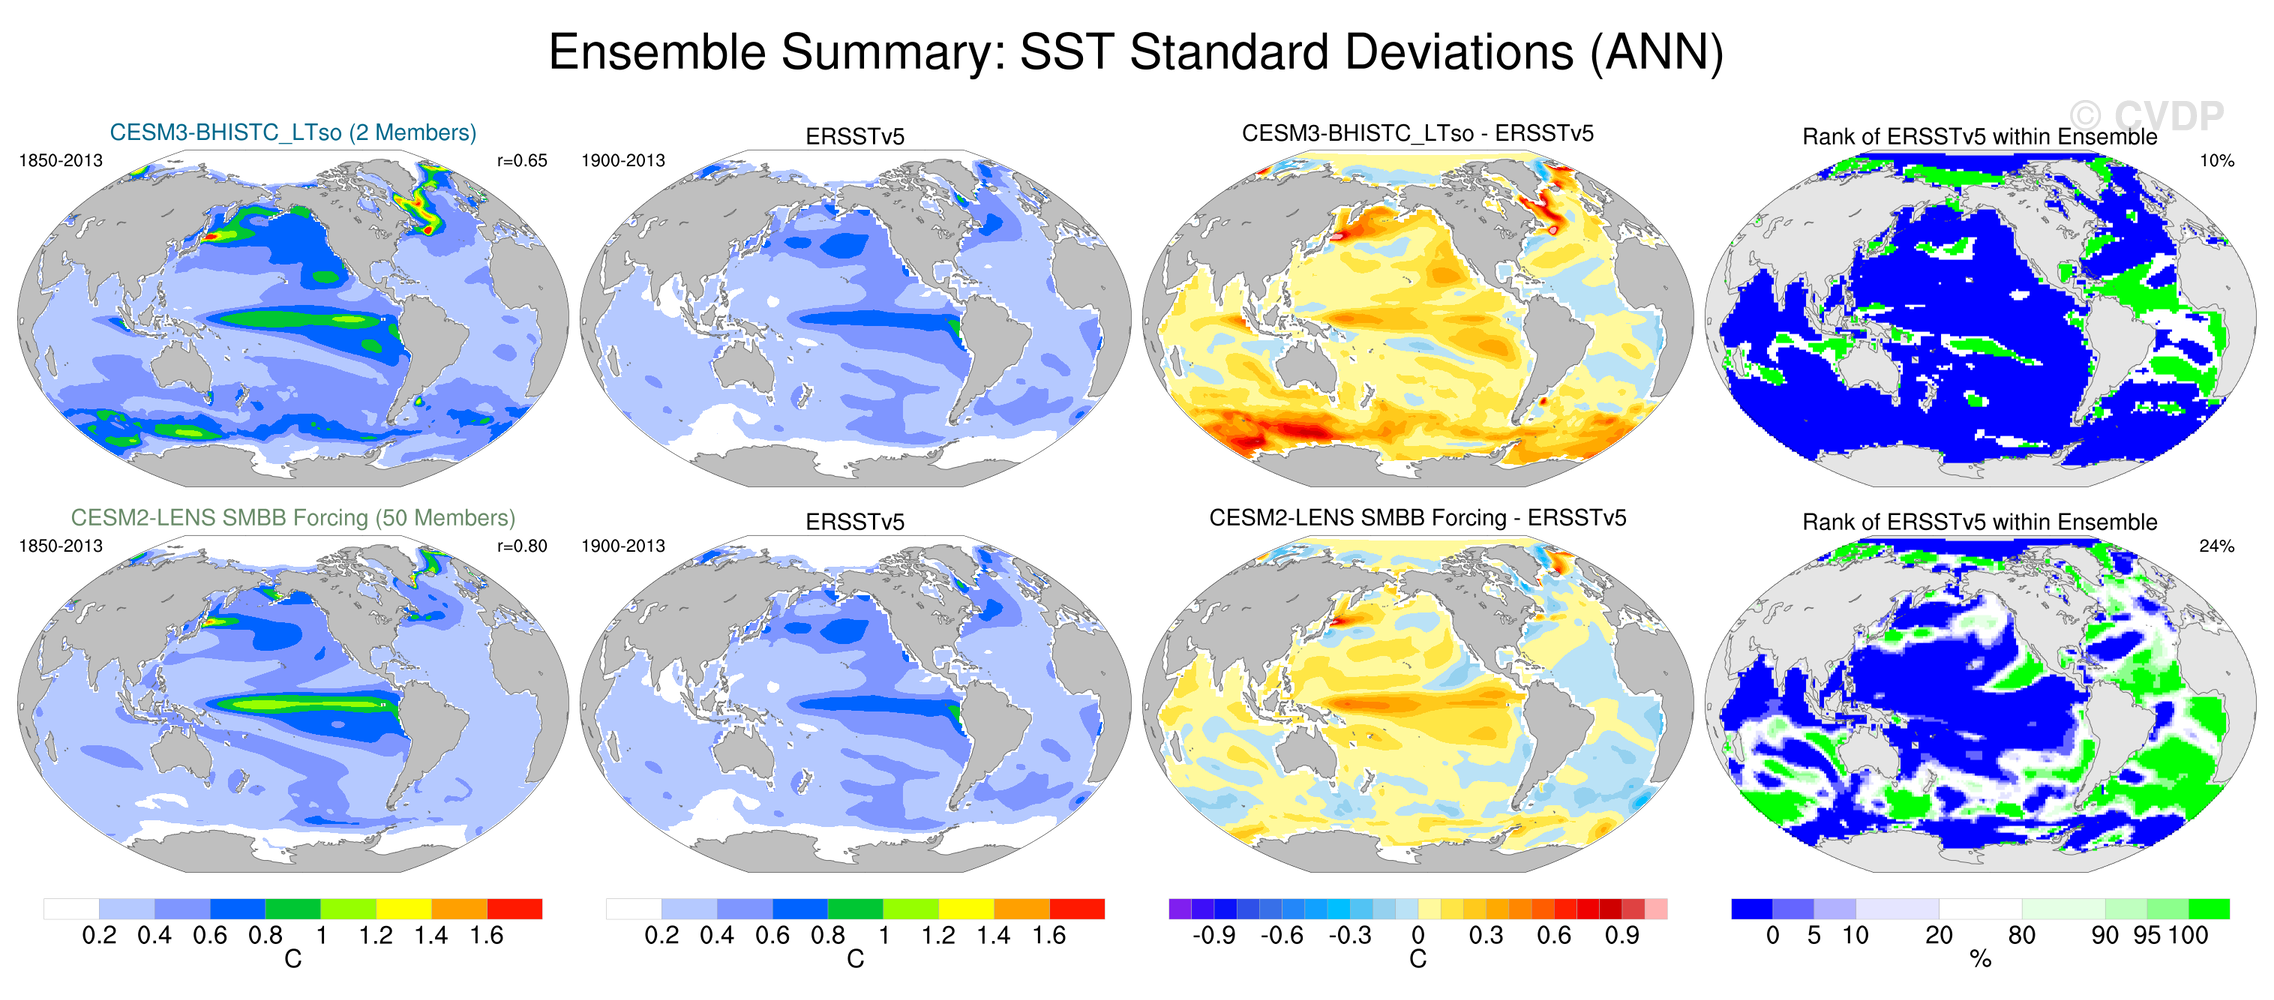
I ran a CVDP comparison comparing 315/316 BLTHIST (treated as a 2-member ensemble) and the 50-member CESM2-LENS SMBB ensemble against 1900-2013 observations. (This was prompted by a conversation with @PeterHjortLauritzen and @jfasullo about how well CESM3 scores in CVDP metrics compared to CESM2-LENS.) Reminder that the CVDP has two main webpages when run in ensemble mode: One that shows ensemble average metrics, and one that shows individual model metrics. Overall: 315/316 score well within the top 25-50% of CESM2-LENS. Improvements from CESM2 are seen in the ENSO RMS differences. One CVDP scoring metric that is notably worse is the annual SST standard deviations, and this likely relates to the thinning of MOM's top level compared to POP's, leading to increased variability notably in the Southern Ocean. 
The mean pattern correlation scores are shown in the lower right. 315/316 average out to be just a bit higher than the CESM2-LENS SMBB ensemble median, and would look even better if we discount the SST standard deviations score.  The mean RMS difference (again in the lower right panel) shows 315/316 to be solidly placed between the 10% and median (larger) bars of CESM2-LENS.
Finally, one specific metric that is striking is the nino3.4 spectra: 
(Gray = observations, Blue = 315/316 mean, Green = CESM2-LENS mean) Two members is not an ensemble, but these improvements are obviously good to see. |
Beta Was this translation helpful? Give feedback.

-
|
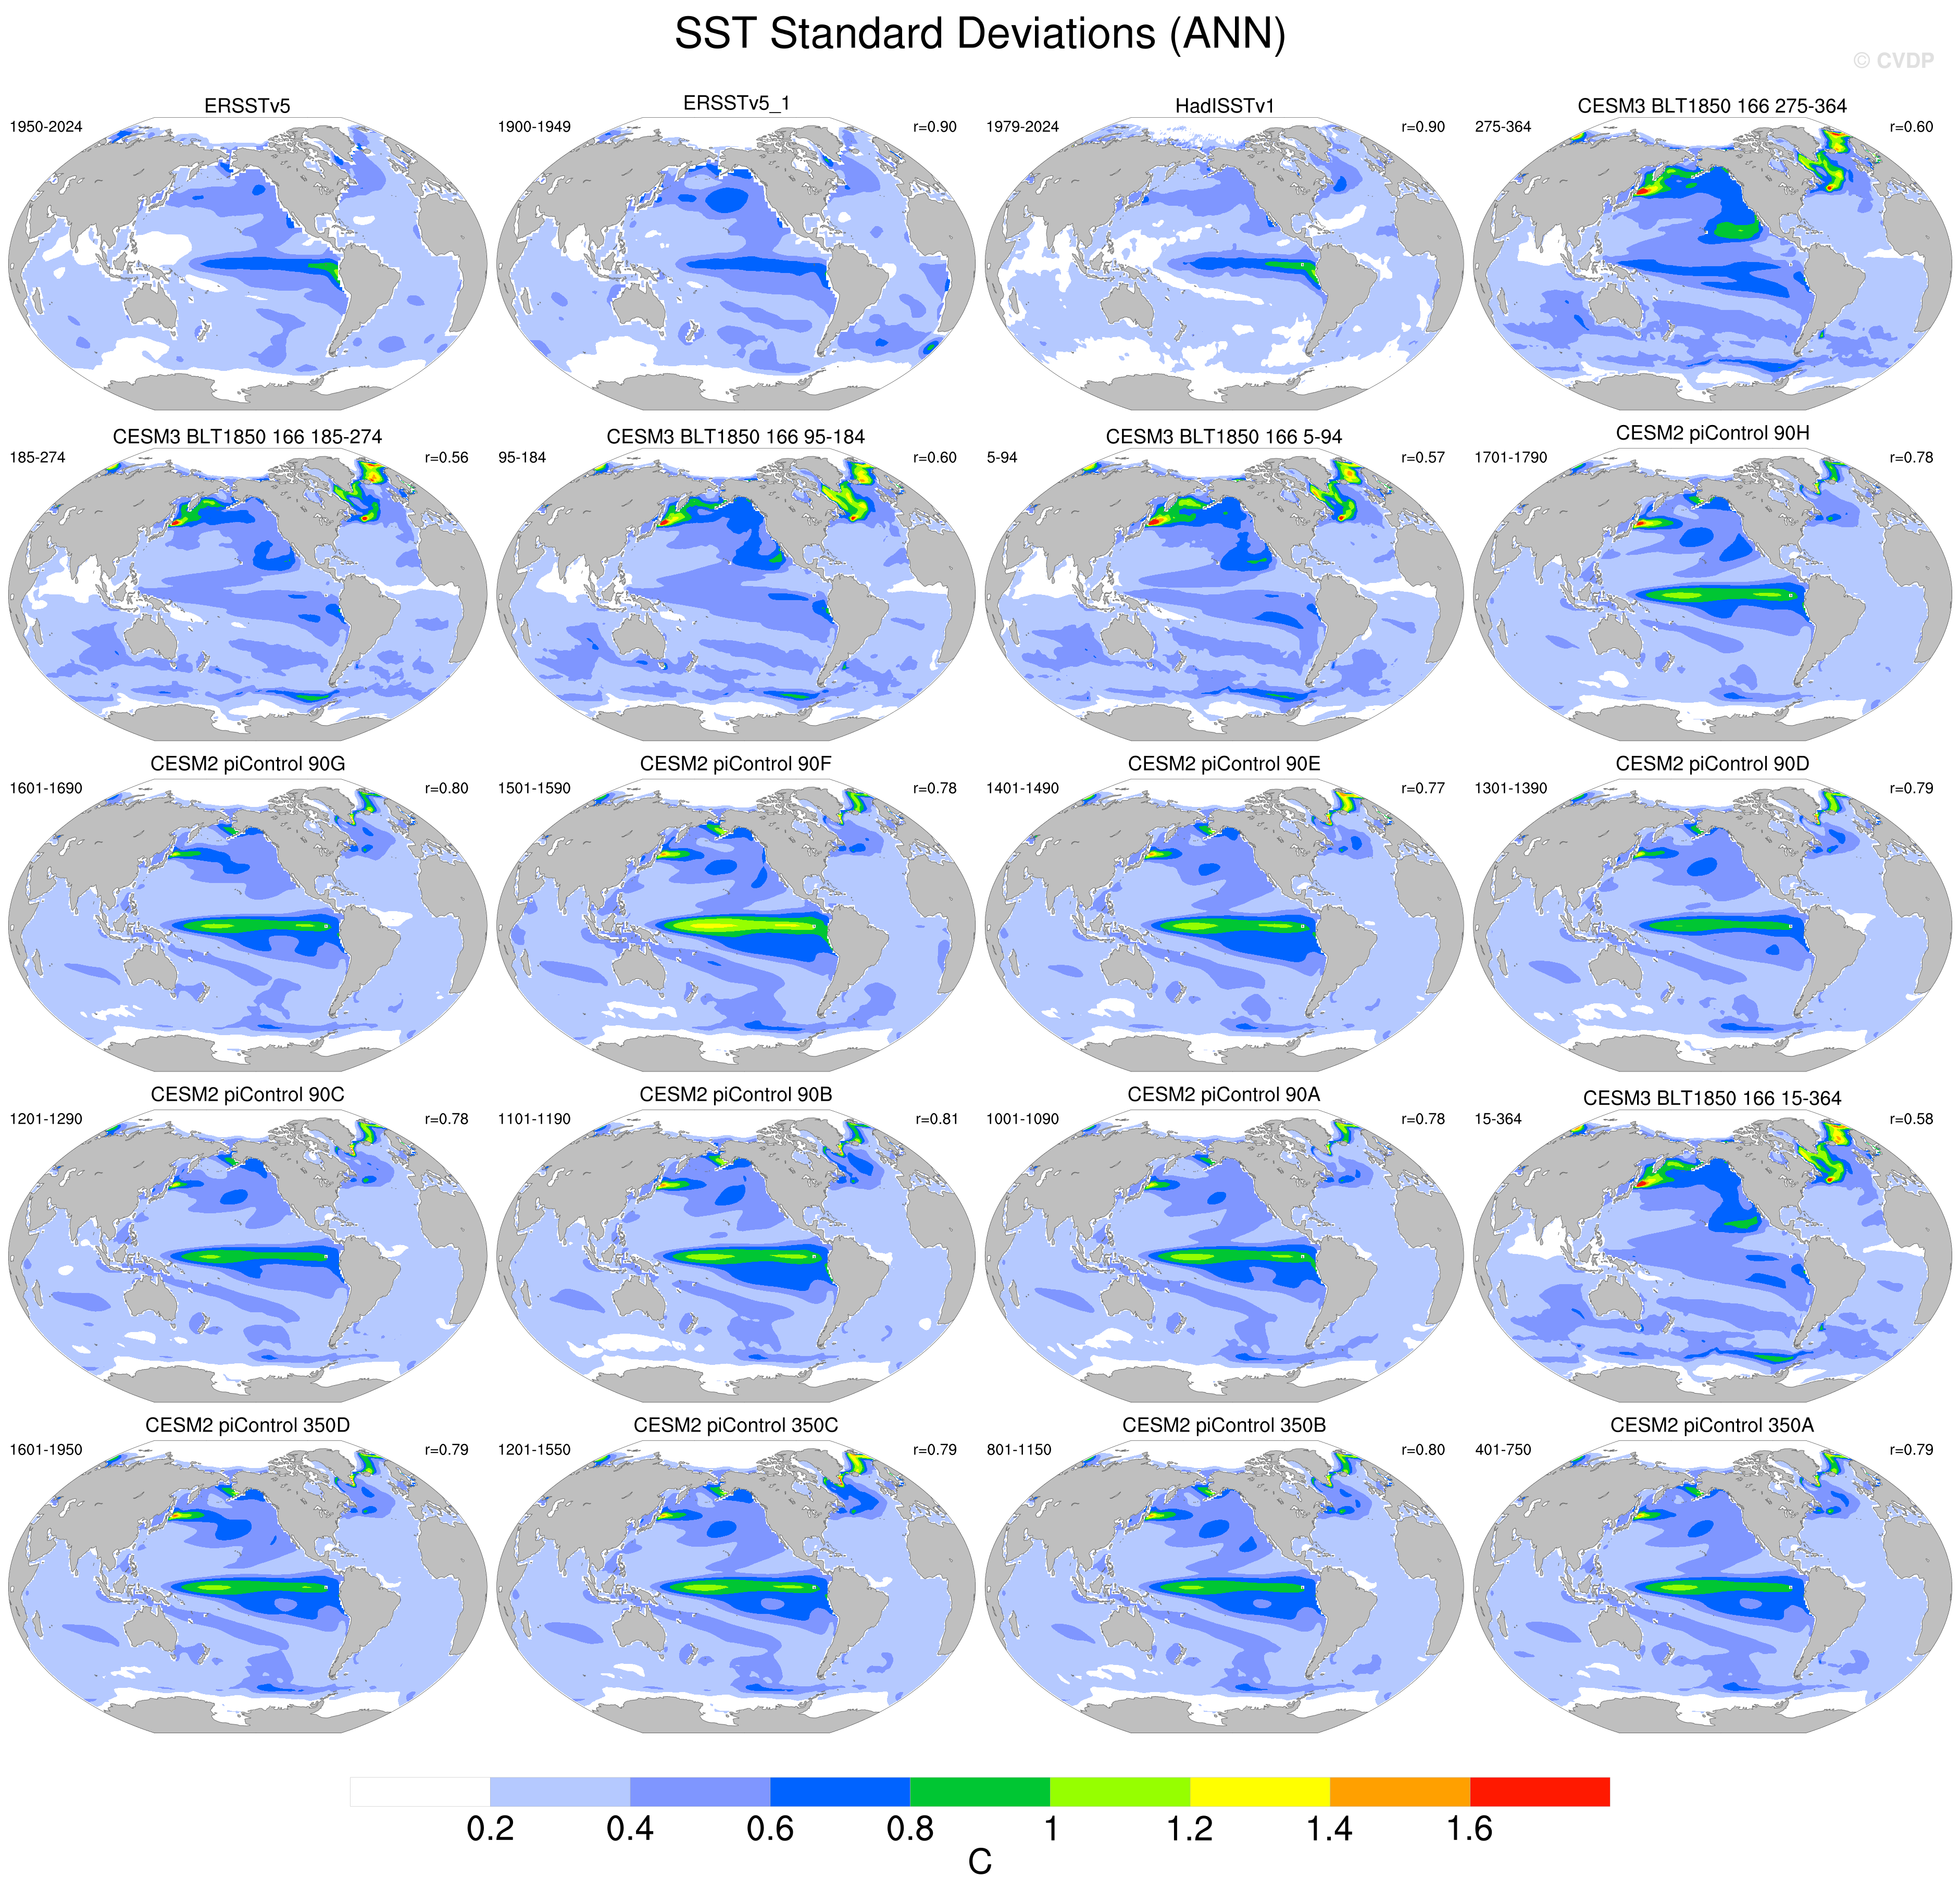
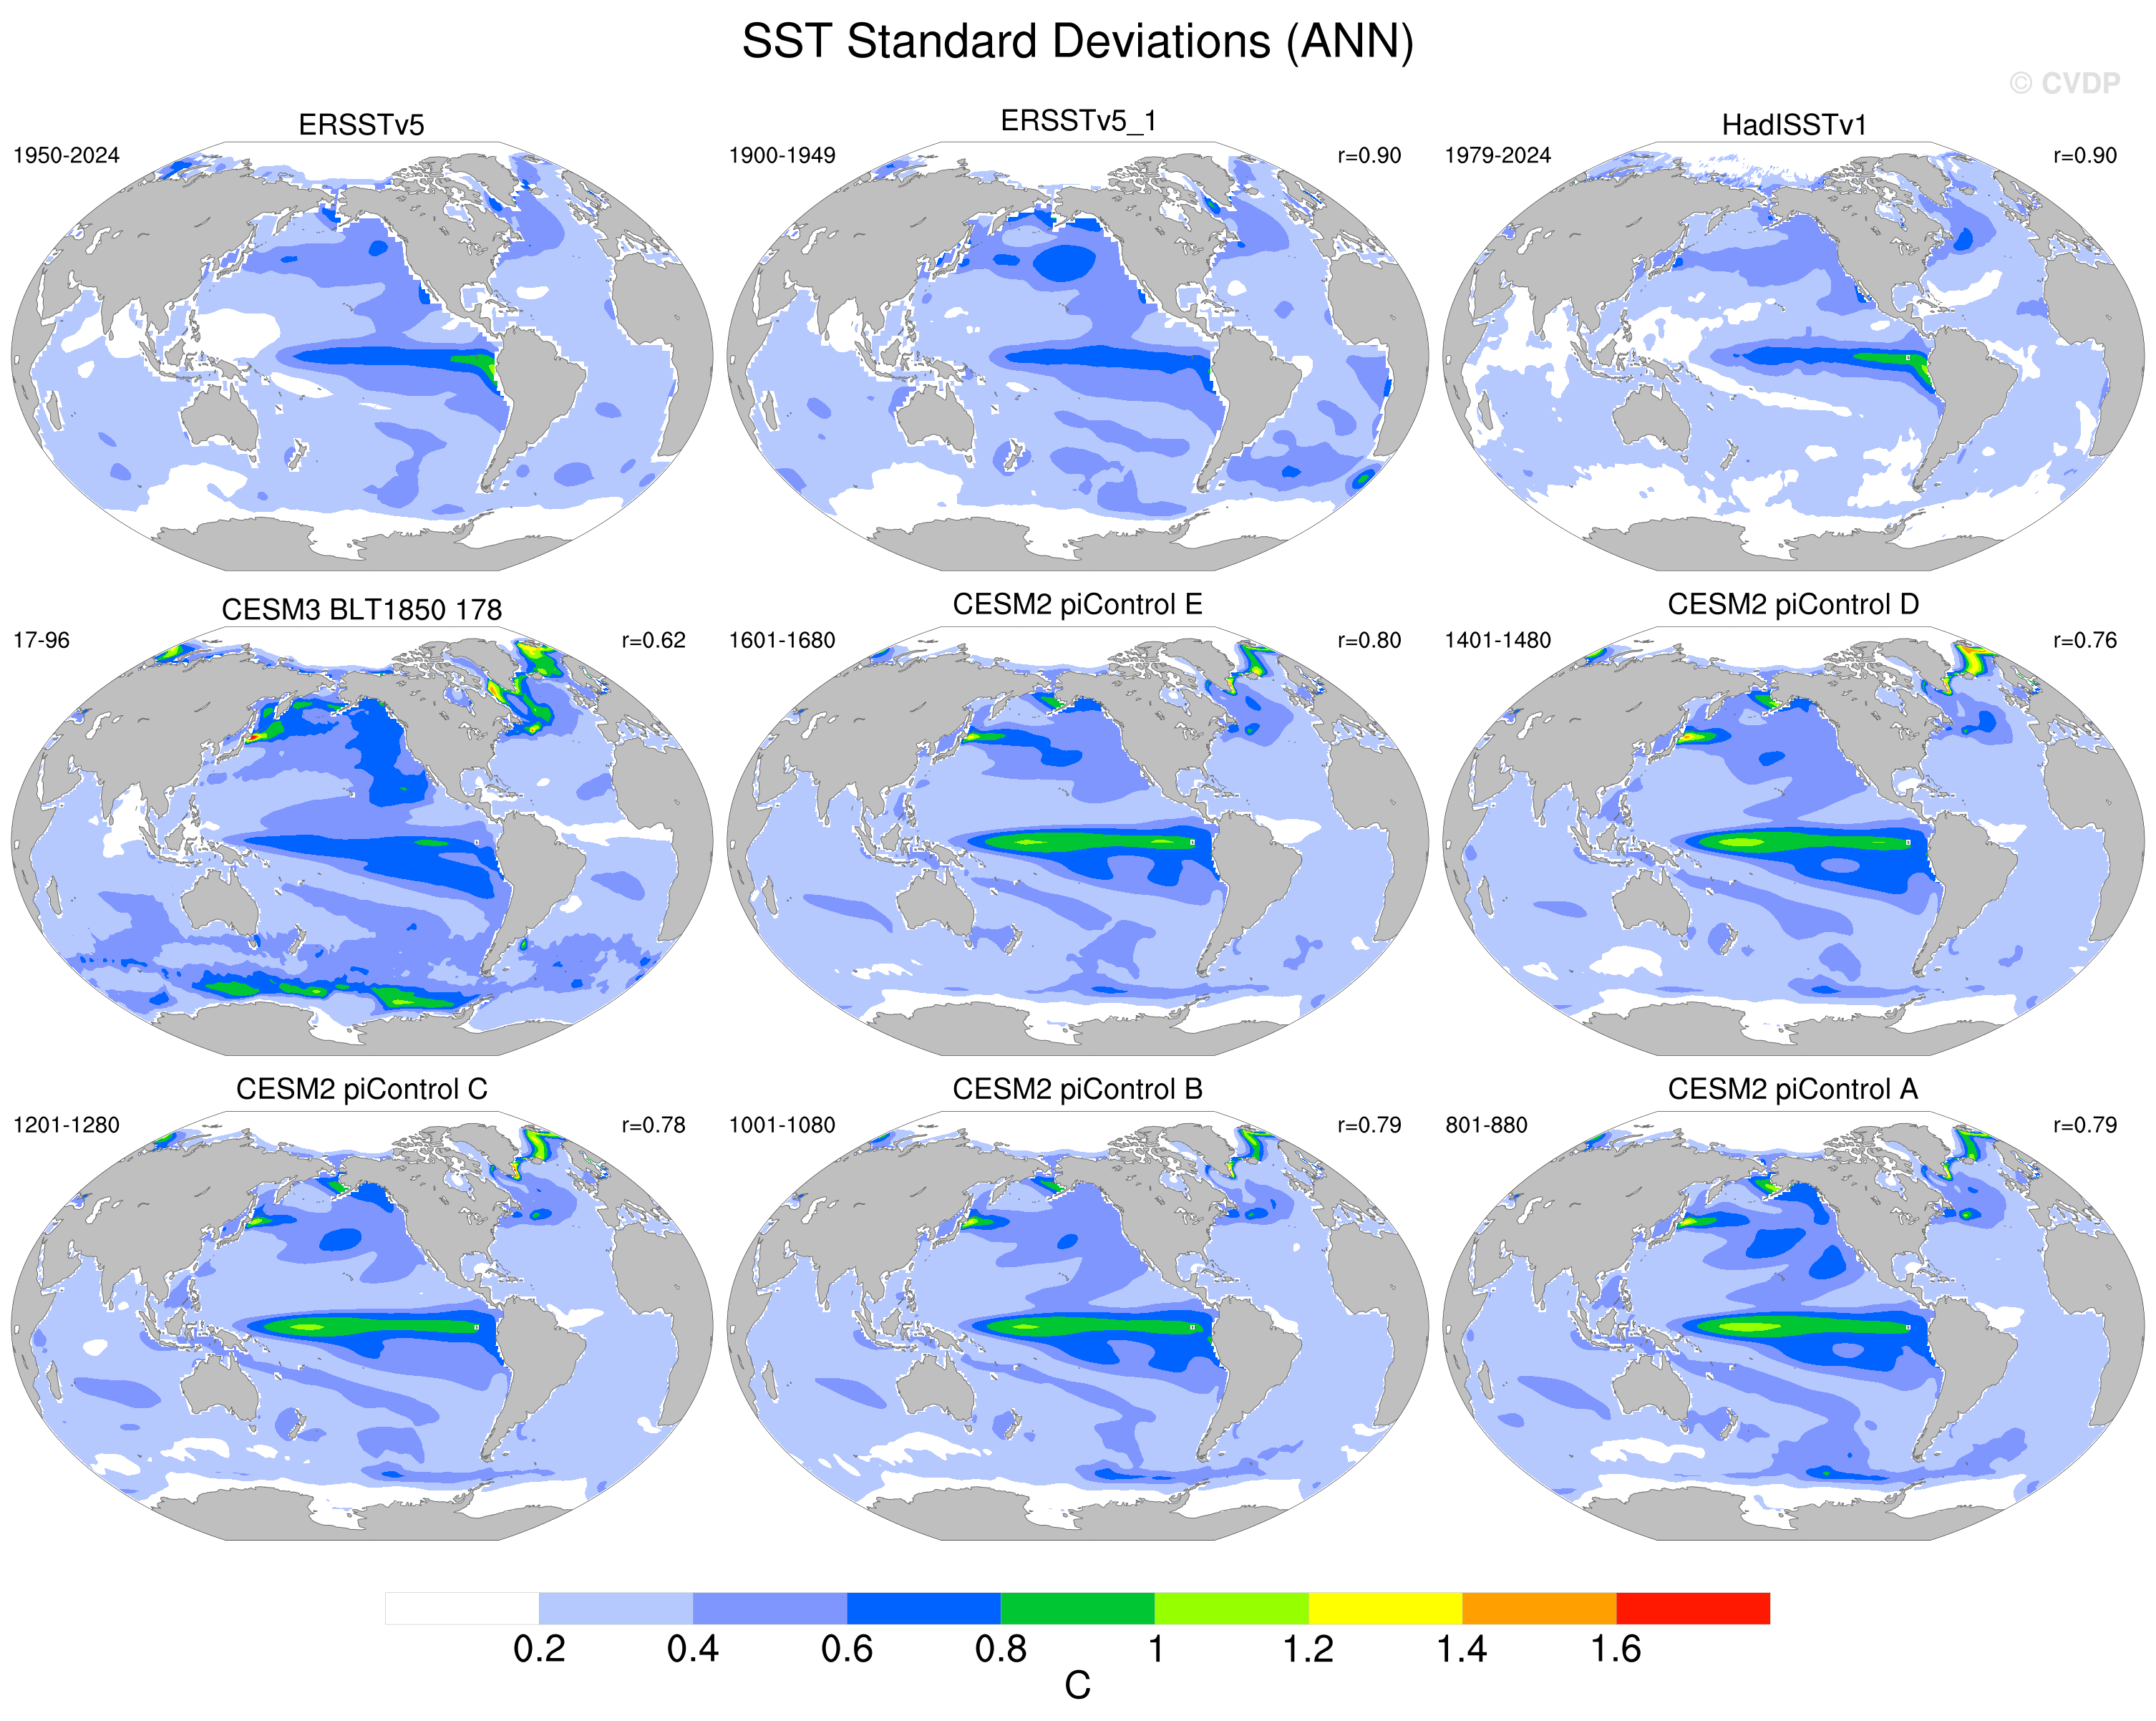
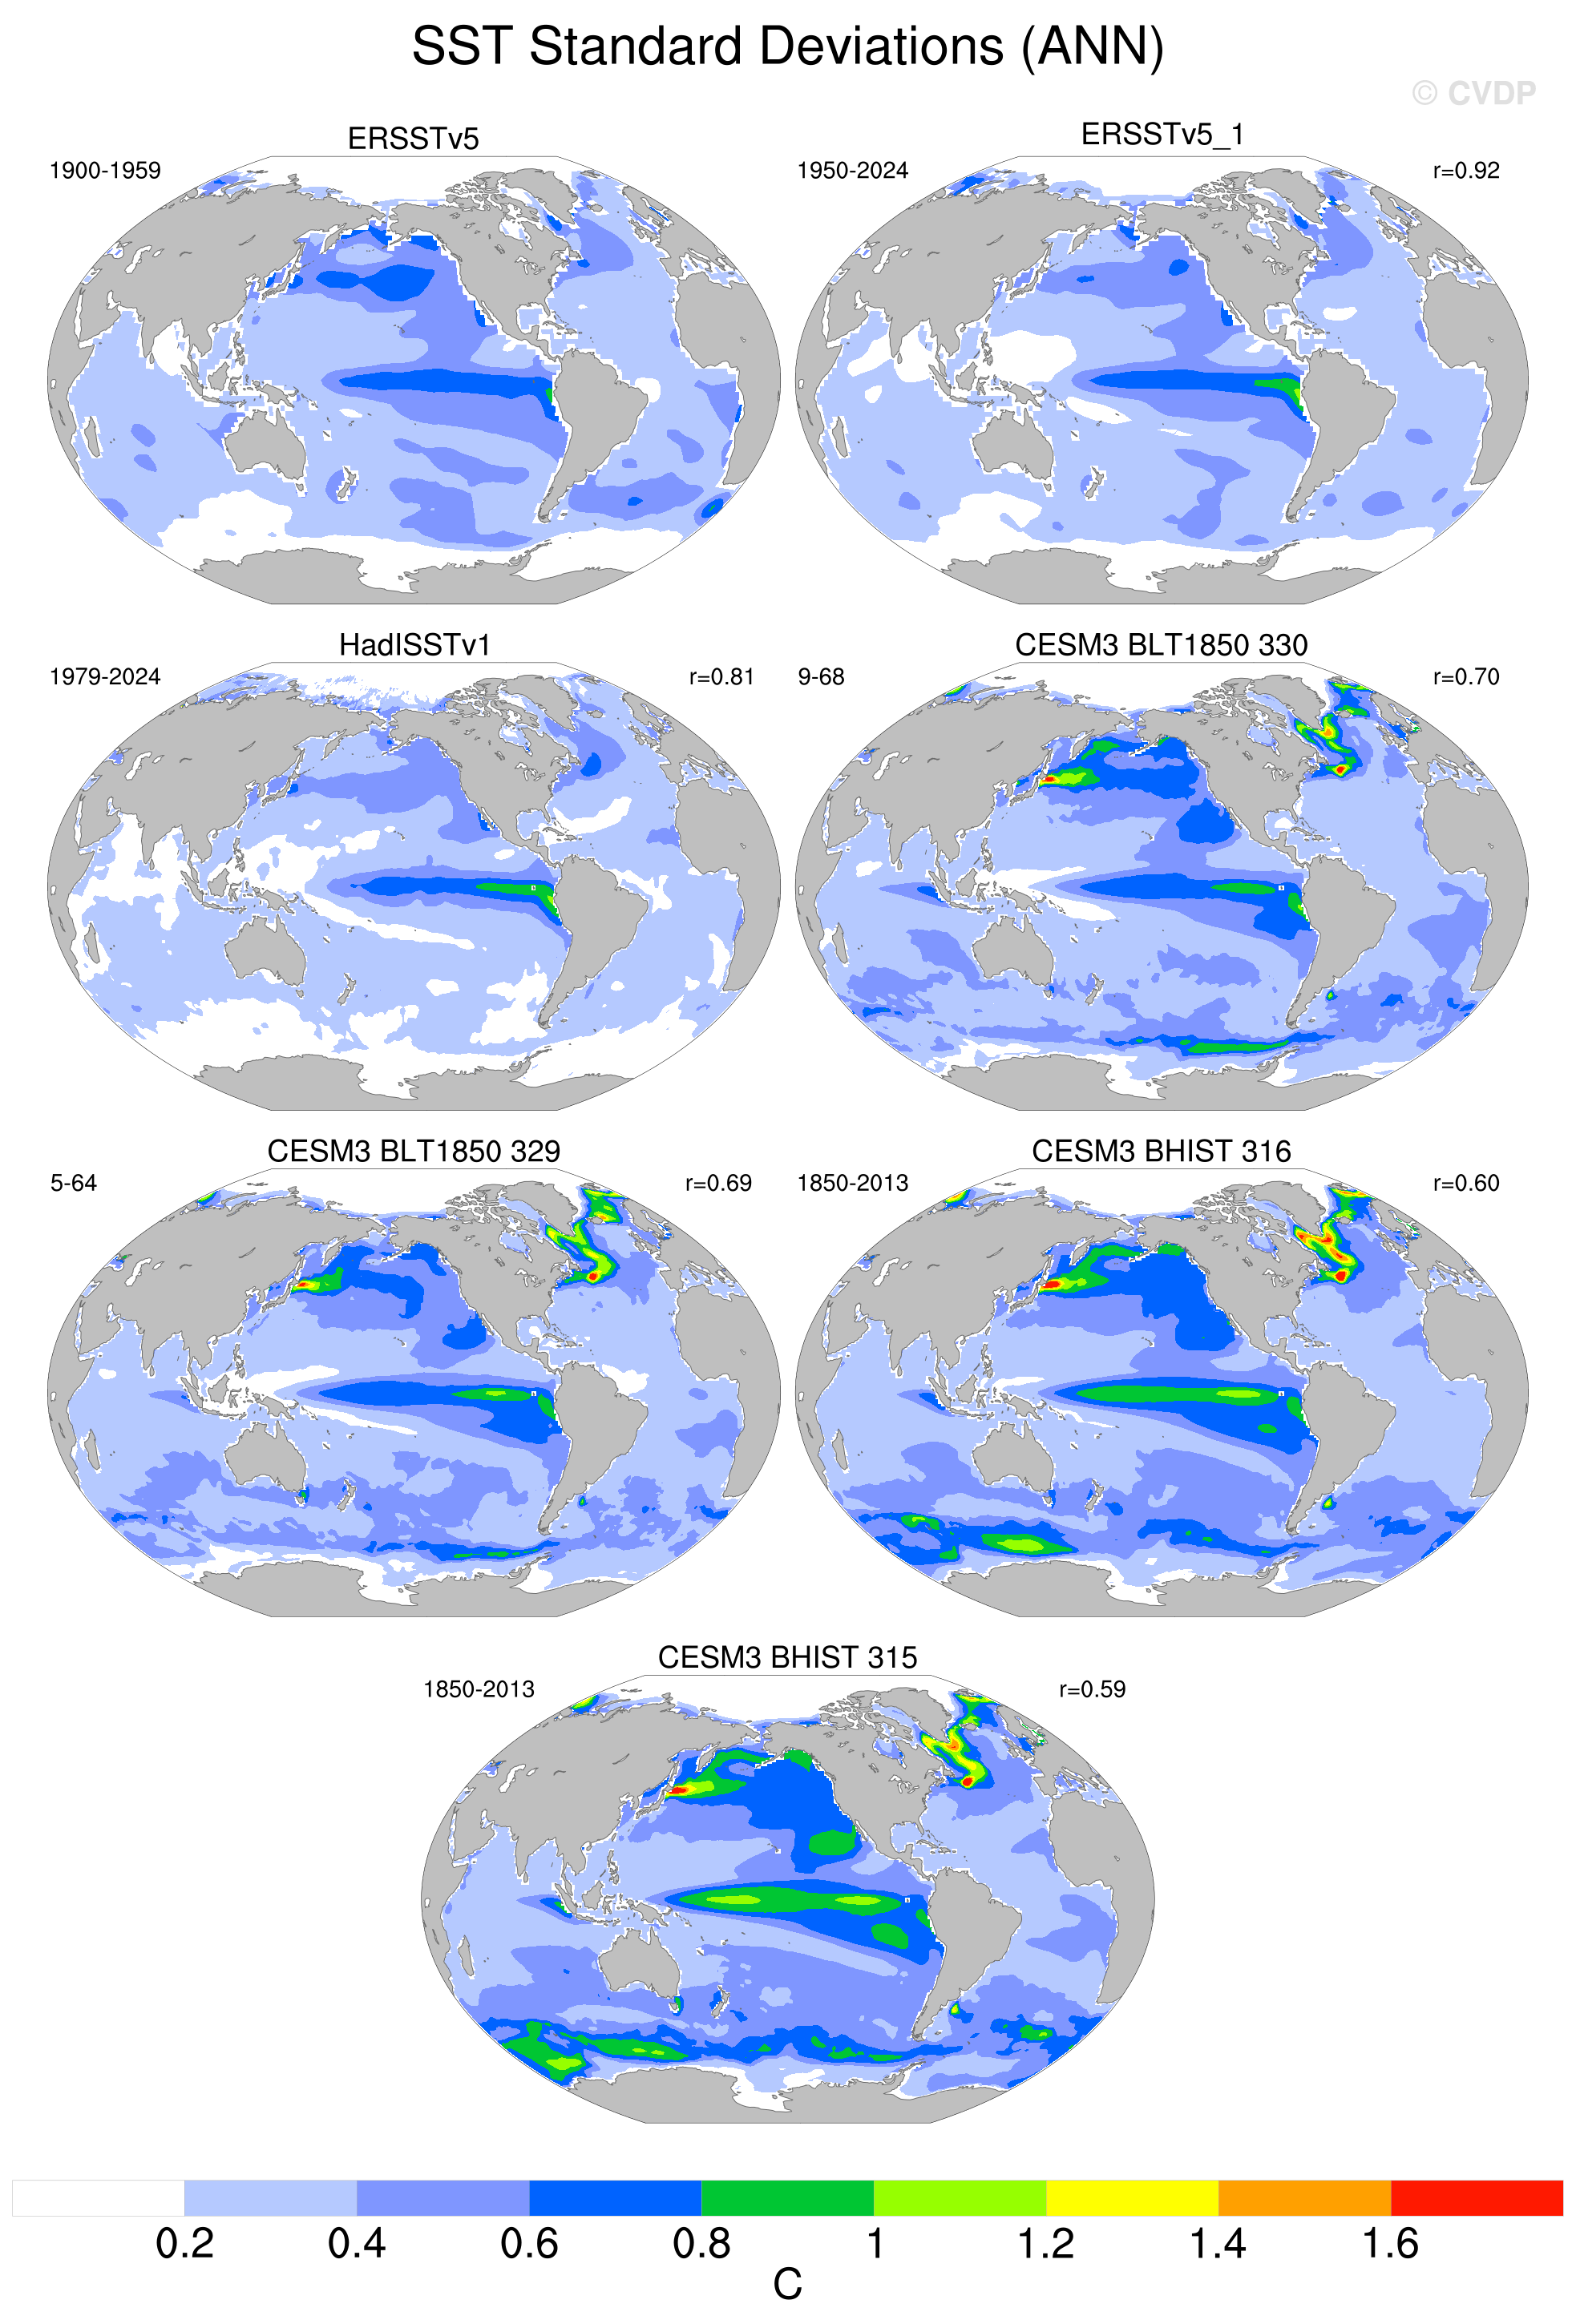
@phillips-ad: thanks for the analysis and summary! I’m wondering whether the larger SST standard deviations in the CESM3 runs could be driven by the stochastic parameterizations enabled in those simulations, rather than differences in top-layer thickness between CESM3 and CESM2. We began using the stochastic GM+E closure in 178, and this appears to explain some of the increased variability in the Southern Ocean (see 166 vs. 178). Other stochastic components have also been introduced a long time ago (e.g., via |
Beta Was this translation helpful? Give feedback.

-
|
Stochastic GM+E significantly increases SST variability, primarily at midlatitudes. The deterministic Leith+E backscatter acts primarily in the tropics. The other stochastic parameterization (Stanley/EOS) has a much smaller effect. We tuned the stochastic GM+E noise amplitude upwards from our initial setting because it helped reduce sea ice extent in the southern hemisphere, reducing a bias. Absent that, I would have chosen a lower value. Similarly, we tuned Leith+E up from our initial setting so that we could get good sub-thermocline zonal jets in the tropical Pacific, which reduces biases in the oxygen minimum zone extent. That said, we still have too little SST variability in G cases compared to observations. Using OISSTv2.1, which is 1/4 degree and daily (cf ERSST which is 2 degree and monthly), the figure below shows that SST standard deviations (after detrending and deseasonalization) for the last 15 years of our most recent G case baseline are mostly still below the OISST data set It turns out that we are seeing a lot more SST variability in the coupled cases than in the G cases. The figure below compares SST standard deviations (after detrending and deseasonalization) for the last 15 years of 316 BLTHIST against the OISST data set. 
Below shows how much SST variability we gain in the B case vs the G case |


Beta Was this translation helpful? Give feedback.
-
|
@phillips-ad - thanks for the analysis. It's good it's looking so good! Just to chime in about the role of the thinner upper ocean layer. We concluded in this discussion that this wasn't really having an impact. The second plot of @iangrooms seems quite at odds with the CVDP plot where there's clearly a lot bigger standard deviation in CESM3 compared to obs over much of the Southern Ocean, whereas Ian's plot shows less over much of the mid-latitudes, if I'm understanding what's shown correctly. Could the higher standard deviation be related to the low frequency ACC variability which may not be so apparent in Ian's shorter timeseies? It looks like the standard deviation in the Southern Ocean might be smaller in our more recent runs which have this low frequency variability alleviated, at least from this CVDP analysis. |
Beta Was this translation helpful? Give feedback.
-
|
Here's a monthly-mean time series from a point in the southern ocean where the CVDP analysis shows large SST variance |

Beta Was this translation helpful? Give feedback.
-
|
Thanks, @iangrooms! Ocean diagnostics for 316_hist are here. Here is the updated ACC transport: |





Beta Was this translation helpful? Give feedback.


Uh oh!
There was an error while loading. Please reload this page.
-
@phillips-ad @swrneale here's a place to discuss ENSO skill and other aspects of variability in the new runs
Beta Was this translation helpful? Give feedback.
All reactions