-
Notifications
You must be signed in to change notification settings - Fork 4
Expand file tree
/
Copy pathAppendix_Shiny_App.Rmd
More file actions
168 lines (96 loc) · 9.75 KB
/
Appendix_Shiny_App.Rmd
File metadata and controls
168 lines (96 loc) · 9.75 KB
1
2
3
4
5
6
7
8
9
10
11
12
13
14
15
16
17
18
19
20
21
22
23
24
25
26
27
28
29
30
31
32
33
34
35
36
37
38
39
40
41
42
43
44
45
46
47
48
49
50
51
52
53
54
55
56
57
58
59
60
61
62
63
64
65
66
67
68
69
70
71
72
73
74
75
76
77
78
79
80
81
82
83
84
85
86
87
88
89
90
91
92
93
94
95
96
97
98
99
100
101
102
103
104
105
106
107
108
109
110
111
112
113
114
115
116
117
118
119
120
121
122
123
124
125
126
127
128
129
130
131
132
133
134
135
136
137
138
139
140
141
142
143
144
145
146
147
148
149
150
151
152
153
154
155
156
157
158
159
160
161
162
163
164
165
166
167
168
---
title: 'Appendix 2: Shiny Application'
subtitle: "Manuscript: Simulation-Based Power-Analysis for Factorial ANOVA Designs"
author: "Daniël Lakens & Aaron R. Caldwell"
output:
html_document: default
---
The goal of ANOVApower is to easily simulate ANOVA designs and calculate the observed power.
However, we recognize that many people do not have experience using the R programming langauge.
Therefore, we developed a "Shiny" application (http://shiny.ieis.tue.nl/anova_power/) which provides a web-based graphical user interface for the R functions.
In the manuscript we referenced numerous simulations, and within this appendix we have reproduced these simulations using the ANOVApower Shiny App.
## Design Input
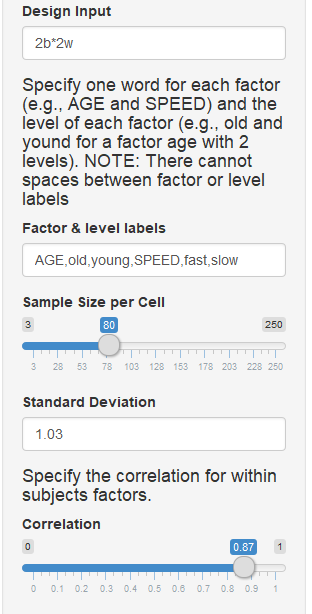
The Shiny App can create designs up three factors, for both within, between, and mixed designs. It requires the following input: design string, factor labels, sample size per cell, standard deviation, correlation for within-subjects factors, a vector of means, adjustment for multiple comparisons, and set the seed number.
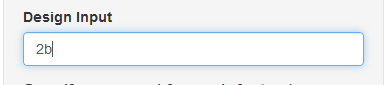
For the design string element, add numbers for each factor that specify the number of levels in the factors (e.g., 2 for a factor with 2 levels). Add a 'w' after the number for within-subjects factors, and a 'b' for between-subjects factors. Separate factors with asterisks. Thus '2b*3w' is a design with two factors, the first of which has 2 between levels, and the second of which has 3 within levels.
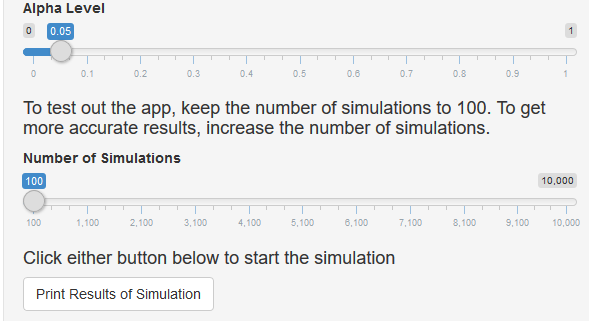
## Simulation Input
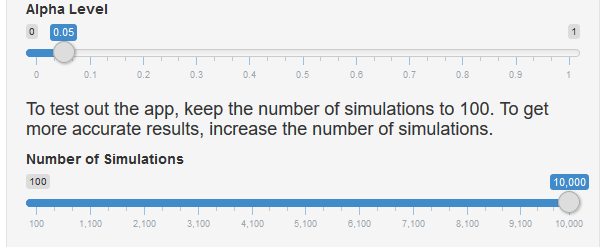
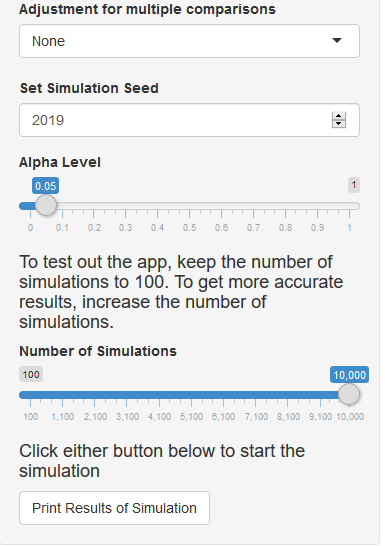
A few more items need to be input for the simulation to run: the alpha level and number of simulations.
## Settings from the manuscript
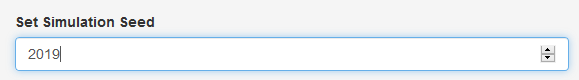
In order to reproduce the simulations from the manuscript we need to set the seed number to 2019 for **each** simulation.
The simulation repetitions should be set to 100000, but the Shiny app has a maximum of 10000.
So, for the sake of this example we will set the number of simulations to 10000.
## Simple 2 group between-subjects design
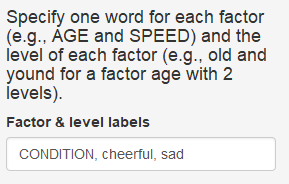
The initial study from the manuscript described a study wherein participants interact with an artificial voice assistant who sounds either cheerful or sad, and enjoyment is measured on scale (-5 to +5).
First, we need to set the "Design Input" to a two-level between-participant design ("2b").
Next, we need to specifiy factor and level labels.
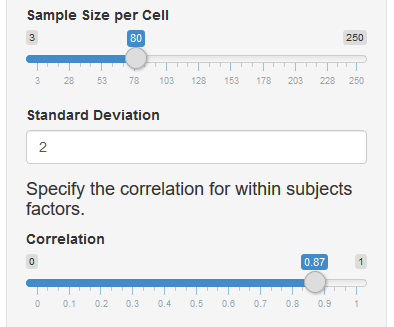
The "Standard Deviation" and "Sample Size per Cell" can now be set to 2.0 and 80 respectively.
Since there are no between subjects factors, we can ignore the correlation.
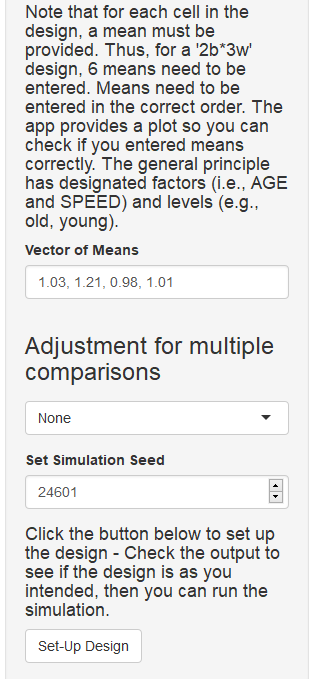
We now enter the vector of means corresponding to the current design.
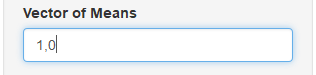
Now, we can click the "Set-Up Design" button.
And we can check the output to ensure the design is entered correctly.
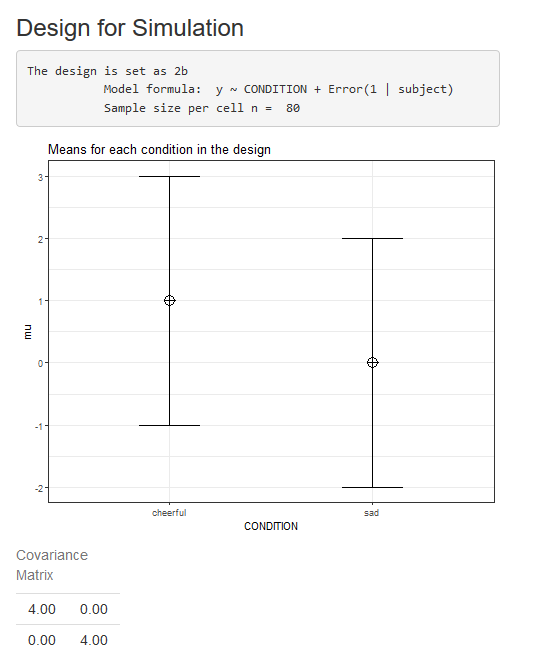
The output is correct, so we can check the simulation settings then click "Print Results of Simulation"
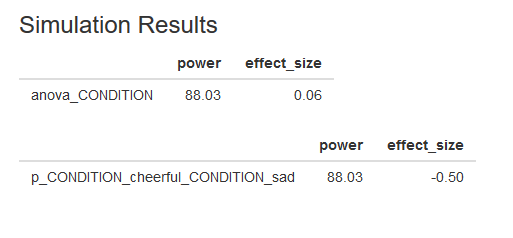
We can also download a Markdown report of the simulation results by clicking the "Download Report" button.
You can find the Markdown report from this "2b" simulation [here](https://github.com/Lakens/ANOVA_power_simulation/blob/master/Appendix/Report_2bSim.pdf).
## Extending to 3 conditions
In the next example, we explored what would happen if we extended the design to 3 between-participant conditions.
This was accomplished by adding a "neutral" condition.
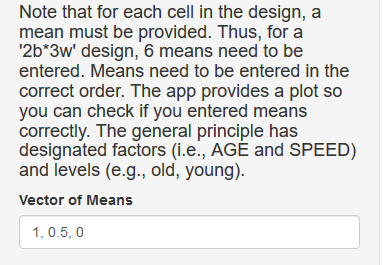
Make sure the labels and mean correspond when specifying the design.
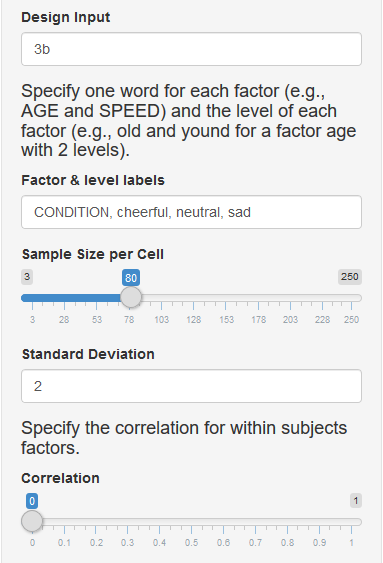
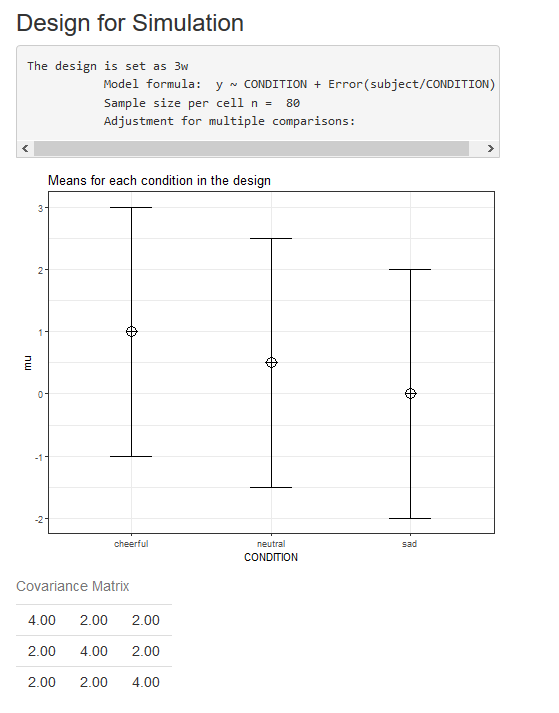
In this scenario, the expected means were 1 (cheerful), 0.5 (neutral), and 0 (sad).
We again check the design output to ensure the design is correct.
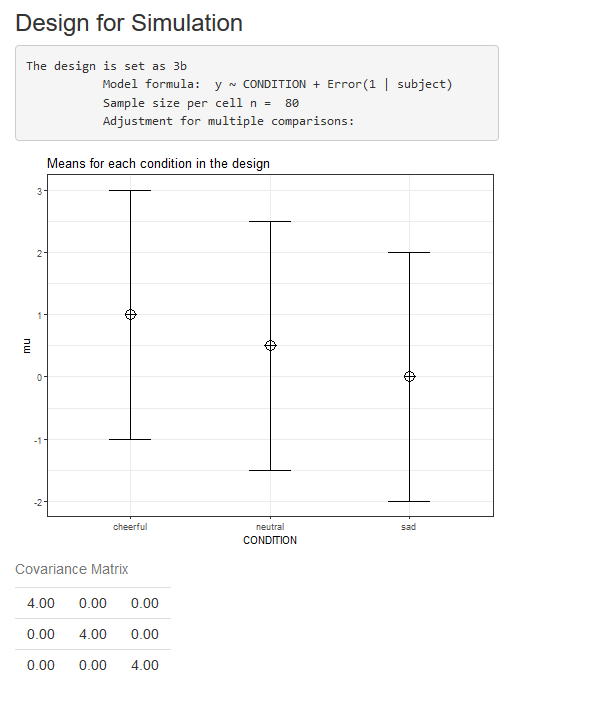
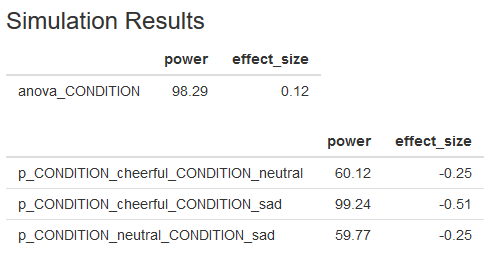
Now we can simulate this design by clicking the "Print Results of Simulation" button. The results should match the image below.

Again, we can download a Markdown report of the results which can be found [here](https://github.com/Lakens/ANOVA_power_simulation/blob/master/Appendix/Report_3b1Sim.pdf).
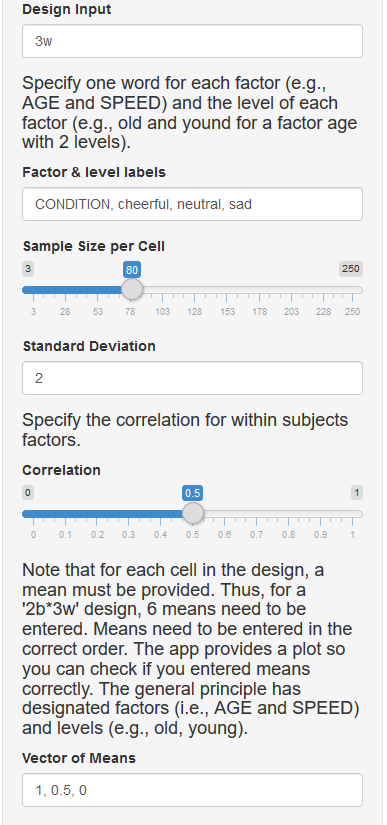
# Changing to a within-subjects design
Now we modify the design by changing it to a within-subjects (i.e., repeated measures) design.
Therefore, the first modification we must make is to the design definition. The number indicated the number of levels for each factor (in this case, a single factor with 3 levels) and the letter specifies if the factor is manipulated within or between participants (in this case within). We must also specify the correlation between dependent measures. Here, we assume the correlations between all three pairs of variables is 0.5 (it is also possible to specify different correlations for each pair by entering a vector of correlations).
Now we have the information to define the design in Shiny App (see below).
This provides the following output in the Shiny app, and we can verify that the design is entered correctly.
The within-subjects design has been specified; now we run the simulation with the following information input in the Shiny app.
This provides the following output.
A Markdown report of the results can be found [here](https://github.com/Lakens/ANOVA_power_simulation/blob/master/Appendix/Report_3wSim.pdf).
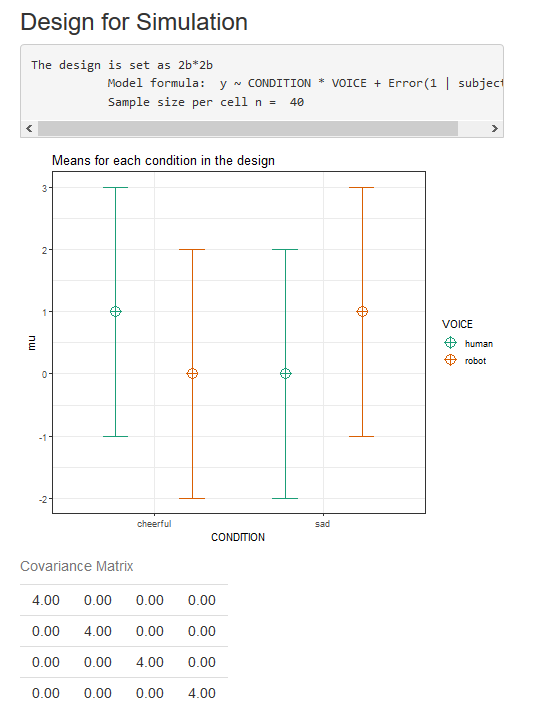
# Power for Interactions: Scenario #1
In addition to simple one-way effects, in the manuscript we demonstrate the power analysis for 2x2 between-subjects design.
In this scenario there two factors "condition" and "voice".
Again, participants are exposed to a "sad" or "cheerful" condition.
However, the voice is either human-like ("human") or robotic ("robot").
Note how we first specify the factor name for the first factor, then the names for all levels of the factor, and then specify the second factor label, and the labels for each level.
For the first interaction simulation, we will also set the sample size to 40 observations per cell.
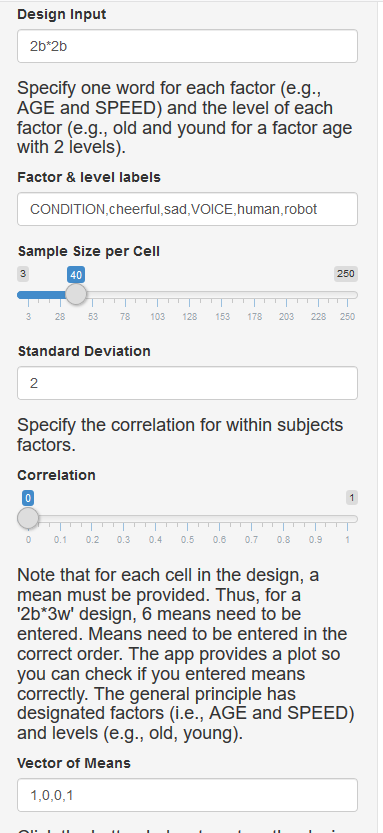
This creates the following design output in the Shiny app.
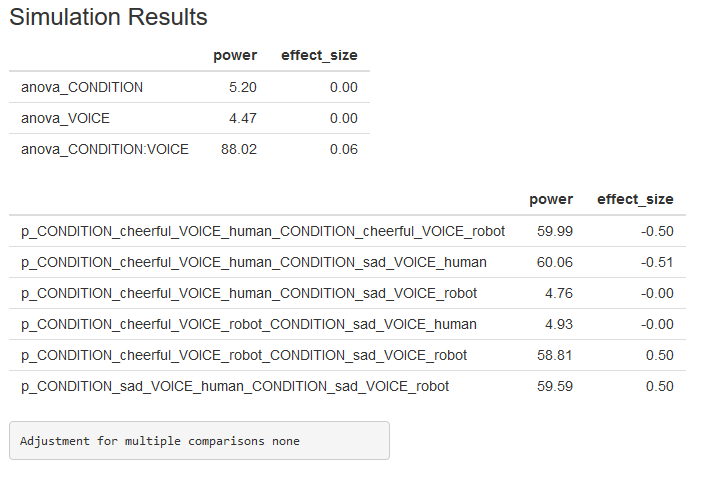
We now can specify the simulation settings.

Which provides the following results, and a Markdown report can be downloaded from [here](https://github.com/Lakens/ANOVA_power_simulation/blob/master/Appendix/Report_3wSim.pdf).
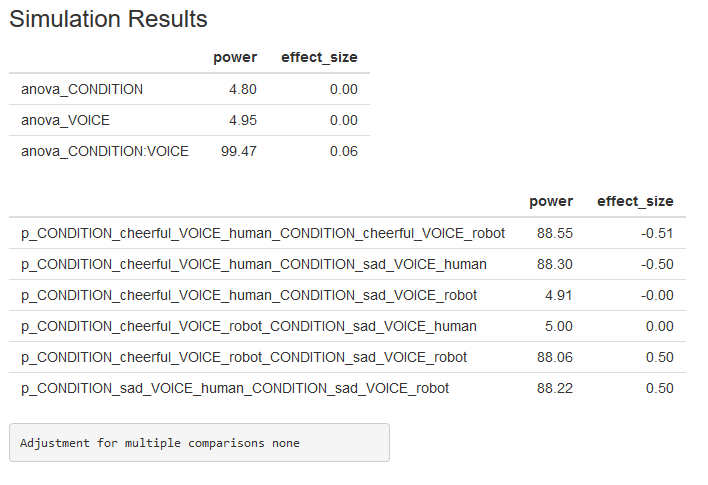
# Power for Interactions: Scenario #2
This simulation is almost identical to the previous simulation.
The only difference is the sample size is increased to 80.
The results of the simulation (n = 80) is included below and a Markdown report can also be downloaded [here](https://github.com/Lakens/ANOVA_power_simulation/blob/master/Appendix/Report_Inter2.pdf)
# Power for Multiple Comparisons
As mentioned in the manuscript, the number of pairwise comparisons, if left unadjusted, can increase the Type I error rate.
So in the manuscript, we revisited the 40 person per group study from the cross-over interaction example.
The design below is the exactly same as the first scenario presented for interactions (see above).
The only difference in this simulation is that we specify a Holm-Bonferroni correction for multiple comparisons.
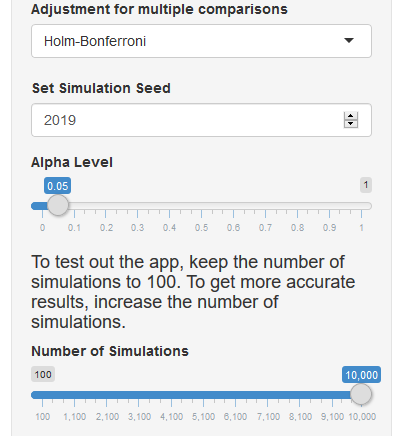
As we can see from this simulation, power for the first pairwise comparison (cheerful-human vs cheerful-robot) is lower now that the Holm-Bonferroni (holm) correction is applied.
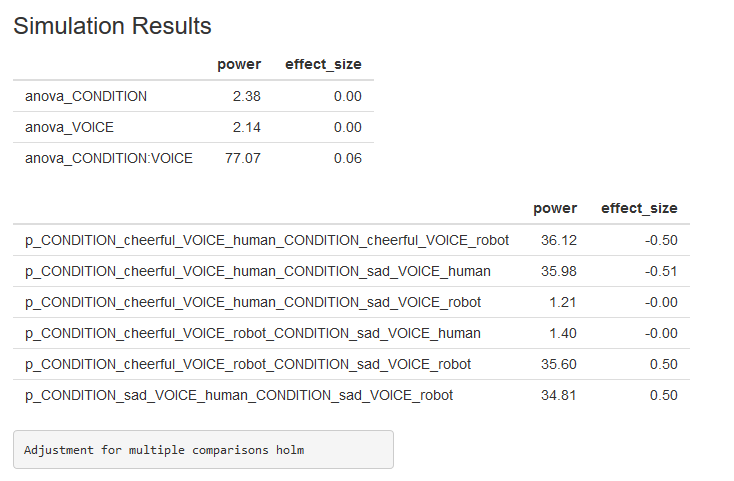
The results of this simulation can also be found in a Markdown report [here](https://github.com/Lakens/ANOVA_power_simulation/blob/master/Appendix/Report_Multi.pdf).