-
From the
config.inifile we found the following information:- L1 instruction cache:
[system.cpu.icache] assoc=2 size=32768 - L1 data cache:
[system.cpu.dcache] assoc=2 size=65536 - L2 cache:
[system.l2] assoc=8 size=2097152 - Cache Line:
[system]
 cache_line_size=64
- L1 instruction cache:
-
For every benchmark the following information can be found in their respective
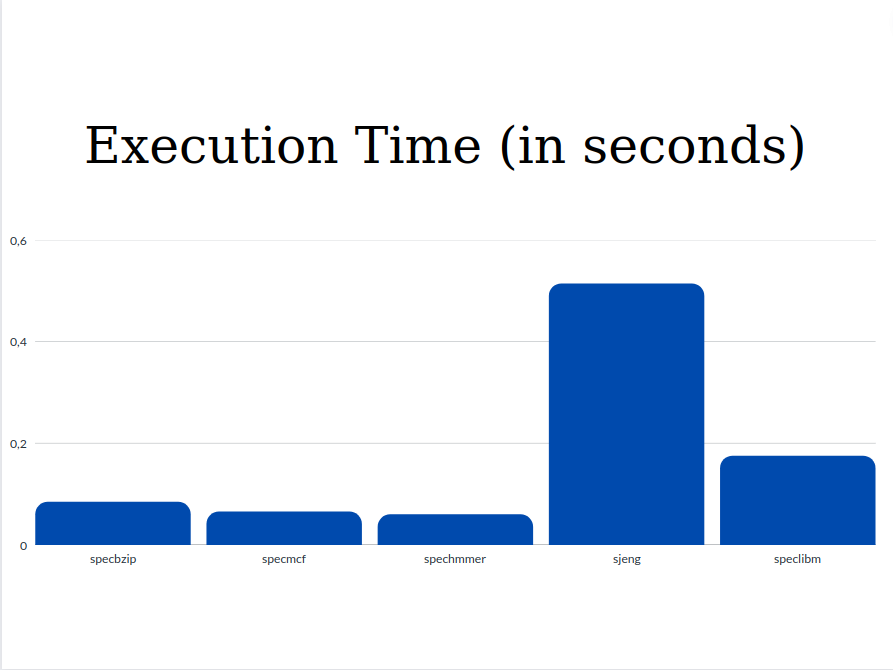
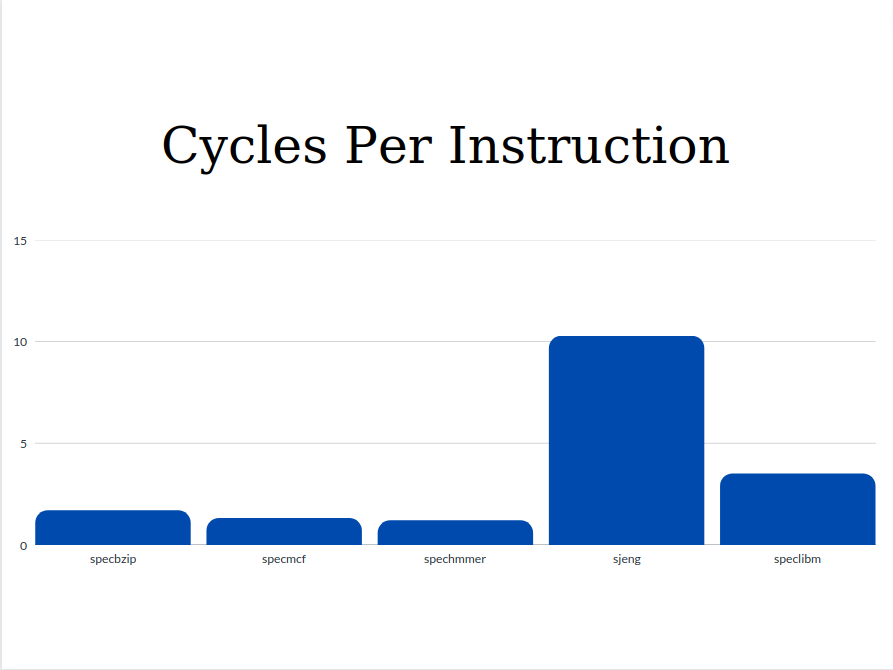
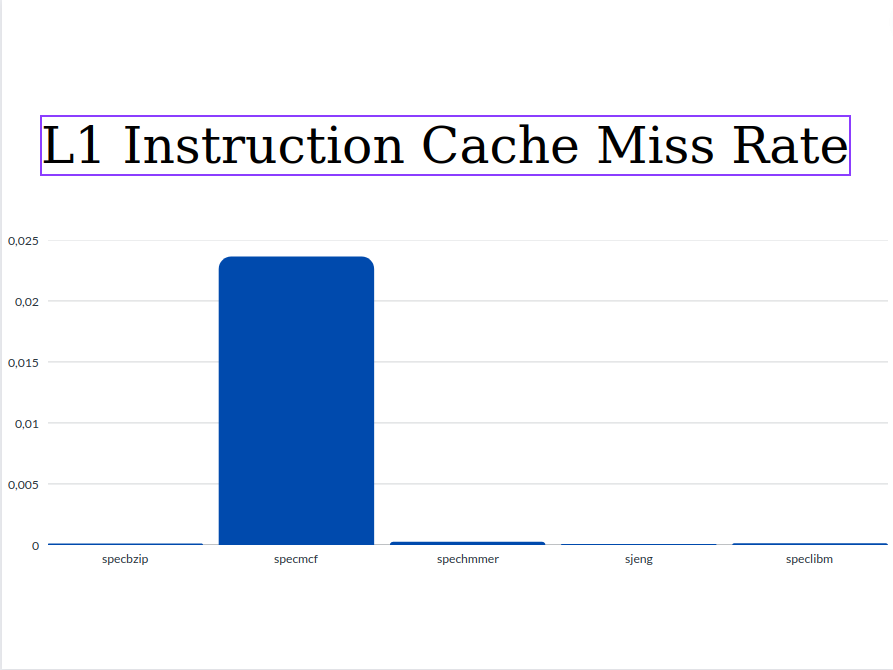
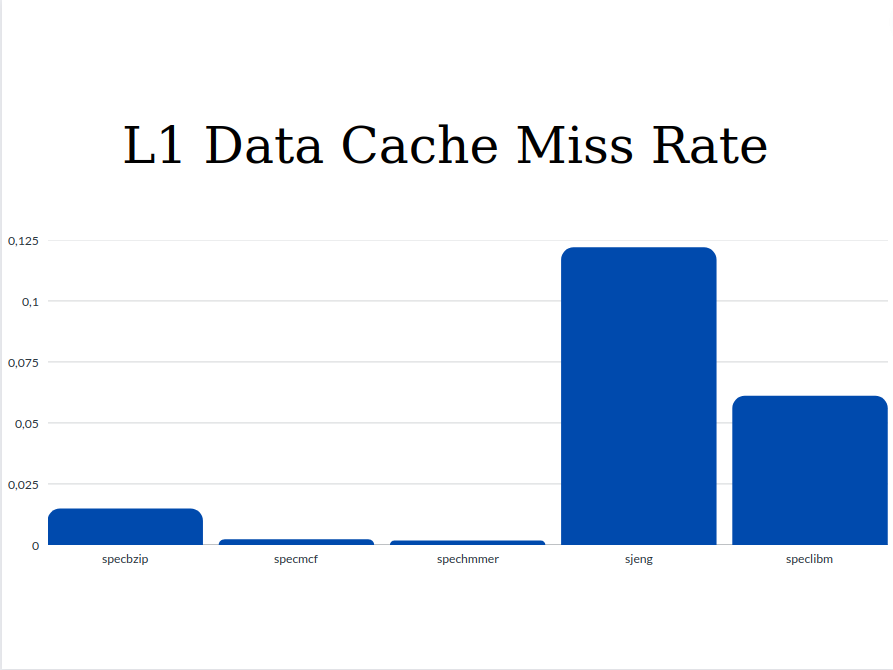
stats.txtfiles:Parameters specbzip specmcf spechmmer sjeng speclbm Execution time 0.083982 0.064955 0.05936 0.513528 0.174671 CPI 1.679650 1.299095 1.187917 10.270554 3.493415 L1 Instruction cache miss rates 0.000077 0.023612 0.000221 0.000020 0.000094 L1 Data cache miss rates 0.014798 0.002108 0.001637 0.121831 0.060972 L2 cache miss rates 0.282163 0.055046 0.077760 0.907550 0.999944 Below are presented the plots for each parameter comparing each benchmark:
- Execution Time
- Cycles per Instruction
- L1 Instruction Cache Miss Rate
- L1 Data Cache Miss Rate
- L2 Cache Miss Rate
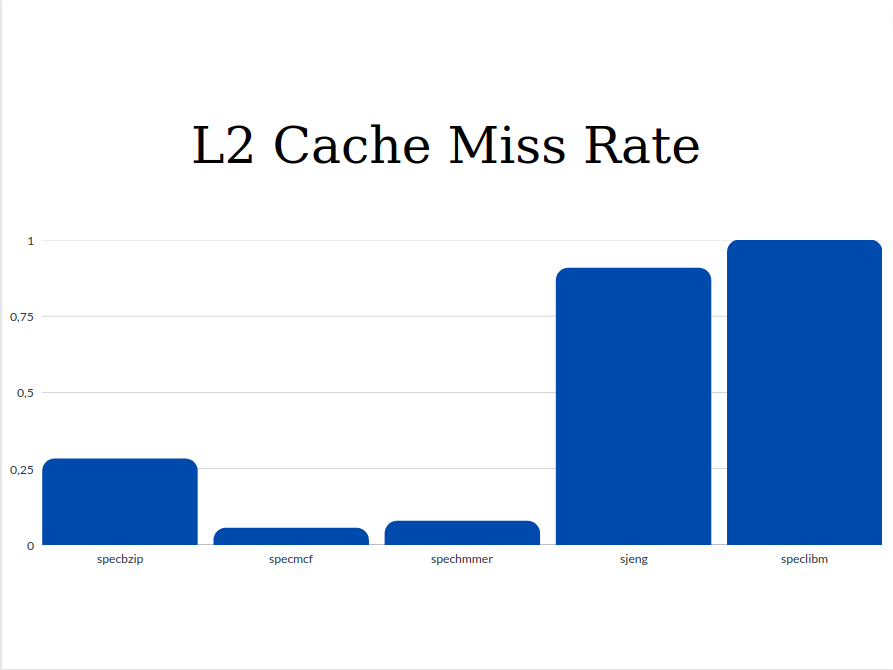
From the graphs we can see that the values of Execution Time and Cycles per Instruction are significantly higher for the sjeng and speclibm benchmarks. This happens because as we see from the miss rates below, these two benchmarks are the only ones with two out three high miss rates (l1 data chache miss rate and l2 cache miss rate). The miss rates as well as the respective access time affect the CPI. So with higher miss rates, higher CPI and Execution Time are expected.
-
For all benchmarks the following values were equal with the respective changes in the frequency:
- Default frequency
- System cpu clock
system.cpu_clk_domain.clock 500 # Clock period in ticks
- System clock
system.clk_domain.clock 1000 # Clock period in ticks
- 1GHz
- System cpu clock
system.cpu_clk_domain.clock 1000 # Clock period in ticks
- System clock
system.clk_domain.clock 1000 # Clock period in ticks
- 3GHz
- System cpu clock
system.cpu_clk_domain.clock 333 # Clock period in ticks
- System clock
system.clk_domain.clock 1000 # Clock period in ticks
There seems to be an inversely proportional relation between the frequency and the System cpu clock. Apparently, when a new frequency is given in the command line, the new system cpu clock is determined by dividing the system clock with the new frequency. Considering this information we can assume that the original frequency is set to 2GHz. We can, also, deduce that when the frequency is changed (1GHz/3GHz) only the system cpu clock is affected, while the system clock remains the same(default GHz). This behaviour can be explained if we consider that the system clock synchronizes all the components of our computer, while the cpu clock is used just for the processor.
If we added a new processor, it would most likely be affected by the change of the frequency and have a different cpu clock, since it is a new CPU and has a seperate clock from the rest of the system.
Based on the execution times we can see that as the frequency increases the execution time decreases. Though, the execution time is not decreasing proporsionaly as we observed with the cpu.clock above. There is not a scalling regarding the execution time because there is not a 1-1 relation between them. The execution time cannot decrease as easily. modifing only one system parameter, but it is affected by a lot others too.
- Default frequency
-
Changing the memory type from
DDR3_1600_x64toDDR3_2133_x64to the sjeng benchmark there seems to be a slight decreament in the simulated time:sim_seconds 0.513528 # Number of seconds simulated sim_seconds 0.493128 # Number of seconds simulated
which is expected since the second memory type has a quicker clock. Also we observed that the cycles simulated are also decreased:
system.cpu.numCycles                       1027055373                       # number of cpu cycles simulated
system.cpu.numCycles                        986256235                       # number of cpu cycles simulated
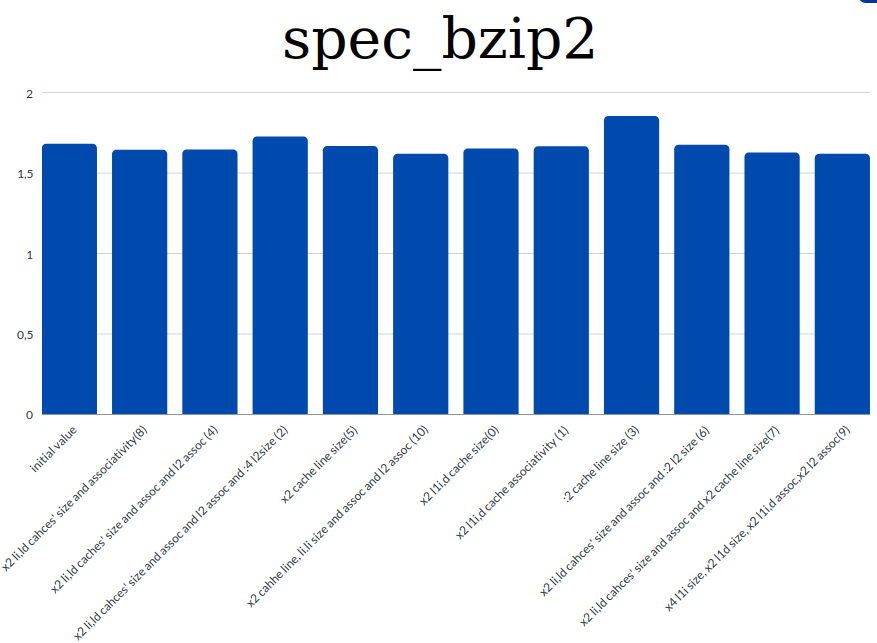
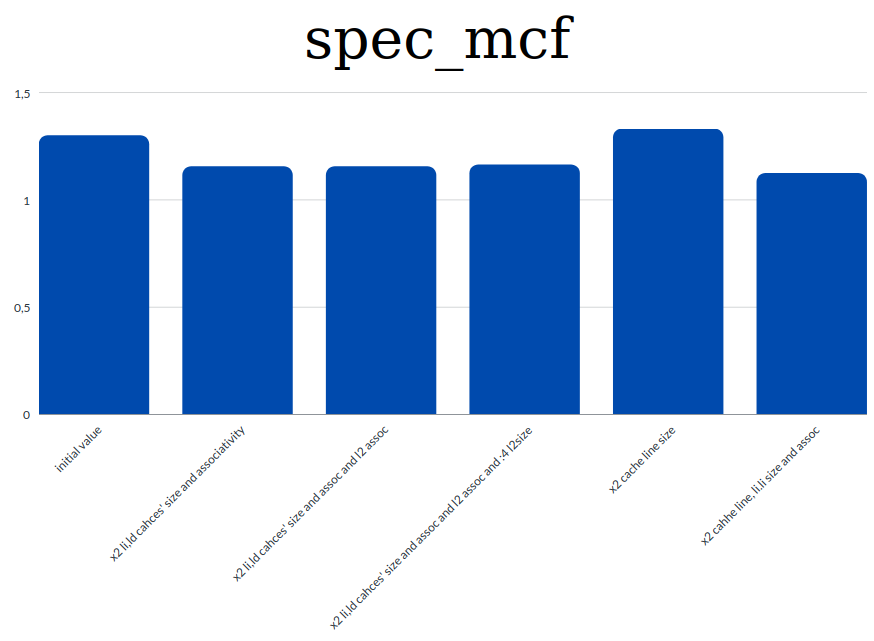
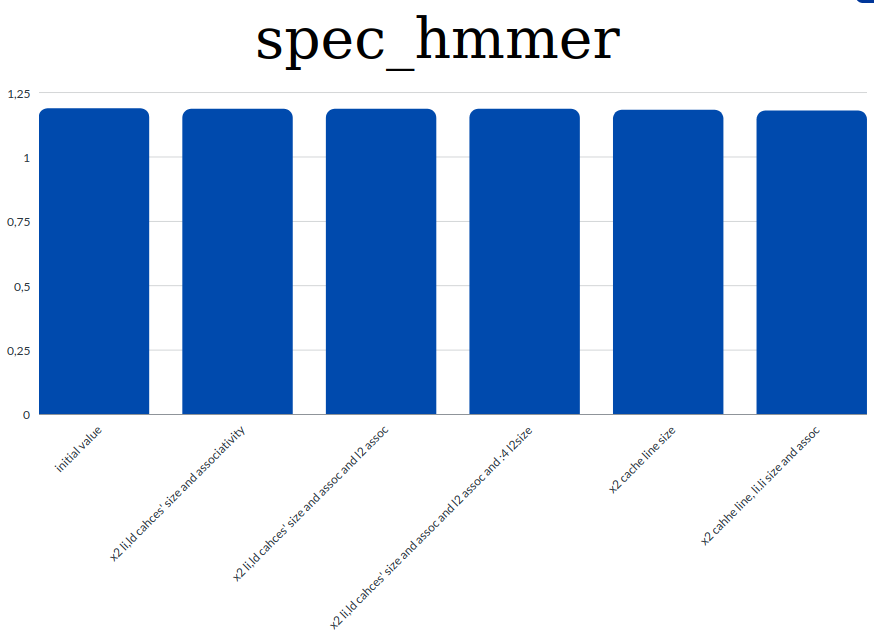
- We run 10 simulations for the first benchmark to test the affection that the parameters had on the CPI. Then for each of the rest of the benchmarks we run 5 simultations adjusting the changes on the values of the parameters accordingly.
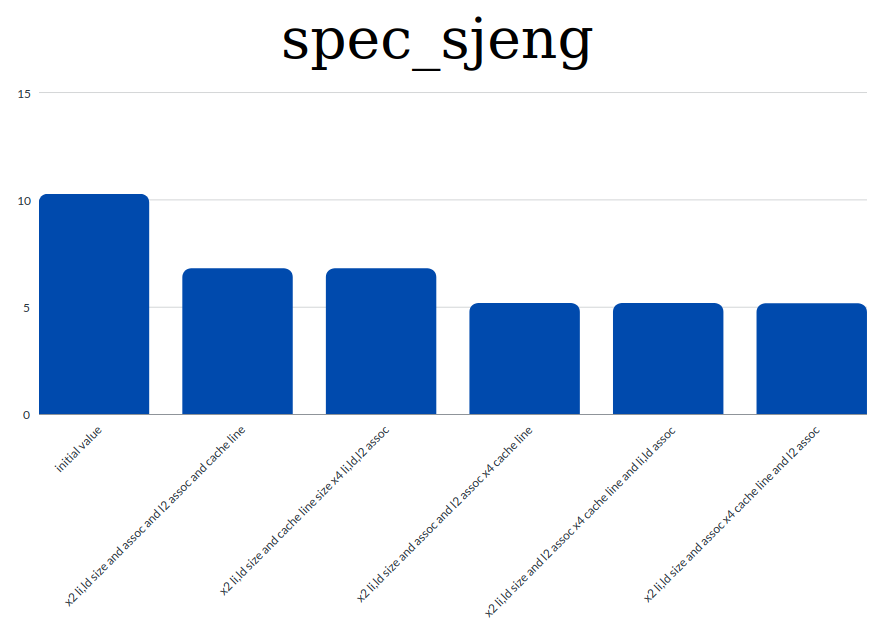
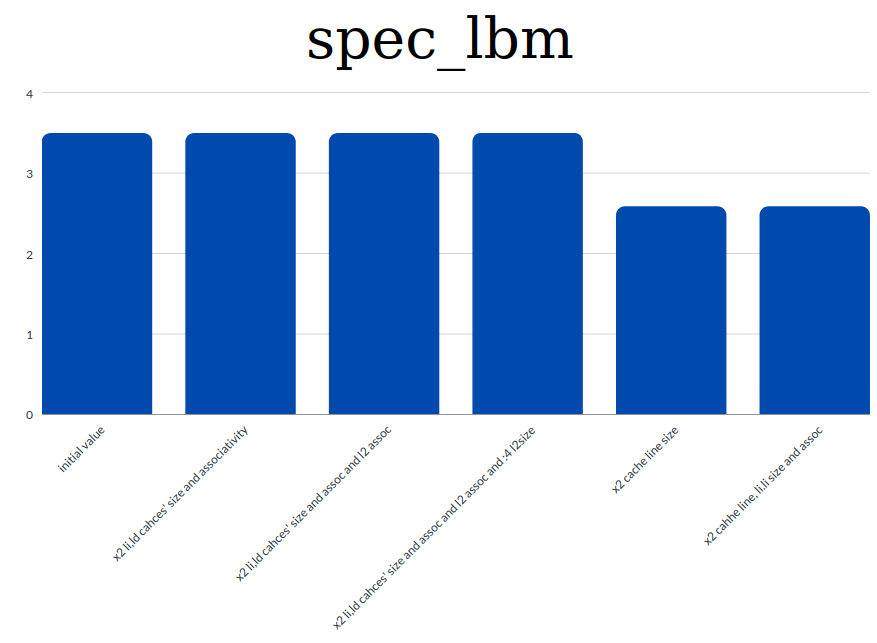
- Graphs for each benchmark about the affections of the parameters on the CPI
-
spec_bzip
-
spec_mcf
-
spec_hmmer
-
spec_sjeng
-
spec_lbm
-
Based on the results shown on the graphs and general information and knowlegde regarding the CPI we extracted the following conclusions:
- the value of the CPI is highly connected with the miss rates. So to achieve a low CPI value we tried to decrease the miss rates.
- we observed that th increament of the caches' sizes and associativities contribute to lowering the miss rates. And this means that we have a lower CPI value too.
- decreasing the cache line size resultes in higher CPI as tested in the first benchmark. Instead by increasing the cache line size we managed to decrease the value of the CPI
Function reagrding the balnce between cost and performance:
- as l1 we have inlcuded both li and ld.
Why we ended up in the equation above : Based on the results from the simulations of the benchmarks we concluded that in most cases the increament of all parameters contributes to the CPI decreament and consequently to a better performance. Though the extensive increament of the parameters leads to a higher "cost". For some parameters more than others:
- We firstly calculated each parameter with the appropriate coefficient in order to make them all comparable.
- L1 cache is more "expensive" than L2. So we used a bigger coefficient for the l1_cahe_size than for l2_cache_size so a doubling in l1_size will give a much larger Cost compared to the one produced be doubling the l2_size.
- The cahce line size increament is not that "expensive" as the l1_size but more than the l2_size. This is also reflected by the coefficients used.
- Same for the associativities. Their increament is not affecting much the cost compared to the cache or cache line sizes.
- The size of the cache line has the same effect as the size of the cache on the perforamnce with different associativity values. As the size increases the different values of the associativity seem to have similar results as far as time and speed are concerned.
- In general larger cache sizes tend to have worse results regarding the speed and time.
To compare the cost for each change, we firstly used the initial values of the parameters and found an initial cost and then for each change we used the new values and found a new cost. The changes withh minimun cost and best performance are the best.
The table below presents the "Cost" - "Performance" results for each benchmark. In the first column the Cost is presented, based on the function above, by using the new values for the sizes and associativities. The "Cost" of the default parameter values is 102,1. In the next columns a cost result is also shown. These values are calculated by dividing the "Cost" value of each line with the decreament percentage of the CPI value for the respective changes vase on the results from section 2. The Cost with the lowest value for each benchmark shows the best option regarding the changes which combines a good performance and a low cost. For negative cost results we conclude that the CPI doesn't decrease, so we have a better performance. (cost result = Cost/(CPI_initial_value - CPI_final_value) / CPI_initial_value)
| Parameters | Cost | specbzip | specmcf | spechmmer | sjeng | speclbm |
|---|---|---|---|---|---|---|
| x2 cache line size | 106.1 | 13628.773 | -4384.2975 | 21222.0902 | - | 406.364247 |
| x2 l1 size and assoc | 198.12 | 8994.8242 | 1785.7014 | 99724.6254 | - | 5673076.88 |
| x2 cache line size and l1 size, assoc and l2 assoc | 202.2 | 5496.0587 | 1493.1104 | 28368.586 | 598.311589 | 774.390171 |
| x4 cache line size and x2 l1 size, assoc and l2 assoc | 210.2 | - | - | - | 423.723846 | - |
| x4 cache line size and l2 assoc and x2 l1 size, assoc | 210.36 | - | - | - | 423.309343 | - |
Based on the results of the table above here are the best options for each benchmark:
- specbzip: 5496.0587 -> x2 cache line size and l1 size, assoc and l2 assoc
- specmcf: 1493.1104 -> x2 cache line size and l1 size, assoc and l2 assoc
- spechmmer: 21222.0902 -> x2 cache line size
- sjeng: 423.309343 -> x4 cache line size and l2 assoc and x2 l1 size, assoc
- speclbm: 406.364247 -> x2 cache line size
Taking all these into consideration we have understood that our choices on the paramters of the benchmarks in section 2, although they were effective on lowering the CPI, they are not as efficient regarding the possible "costs". (specifically we have choosen a really large size for the l1 cache)
References:
- Difference between CPU clock and system clock
- Caches affection on CPI
- Miss rate relation to CPI
- Associativity
- Associativities Advantages and Disadvantages
- Αρχιτεκτονική Υπολογιστών: Μια ποσοτική προσέγγιση, 6η Αμερικάνικη Έκδοση, John L. Hennessy, David A. Patterson, σελ. 121, Εικόνα 2.8